Historical statistics - would be good if historical daily, monthly, and annual statistics were available #42
Description
This issue highlights a discussion to have with the State
One of the challenges with providing context, for example to hydrographs, is that historical data must be queried and analyzed so that current conditions can be presented relative to that historical data. For example, it is useful to show how current flow compares to the historical mean or median. This can be done by drawing a line of mean or median on a hydrograph, or by color-coding points on a map based on percent of mean/median.
However, to do this on the fly requires that the consuming application must query the entire period of record (a load on the server, eats up request quotas, and can be slow), process the data, and display.
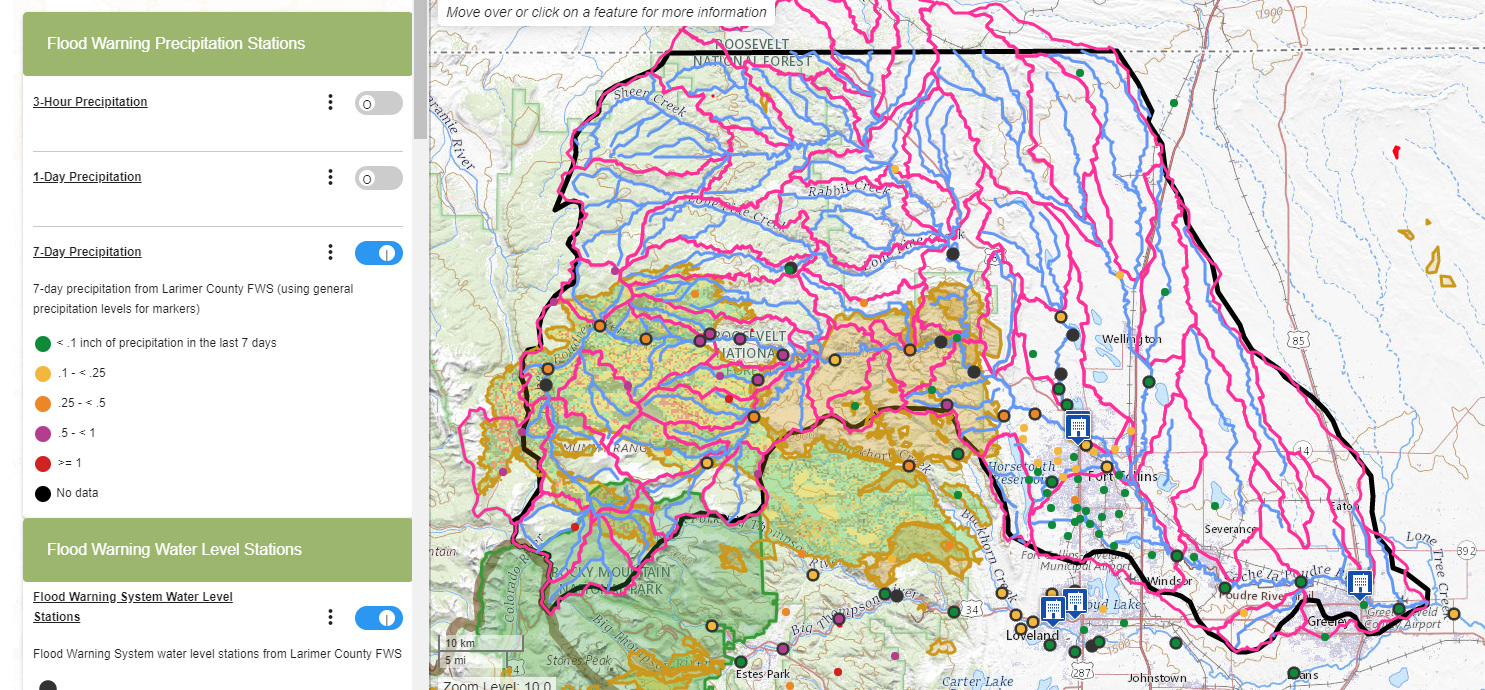
An alternate solution would be to have web services provide historical statistics in a way that supports the above use cases. This is likely already being done behind the scenes to support the DWR plots. The goal is not to replace the DWR plots, but to allow other applications to provide more specific data views (and can link back to DWR). As an example, below is a map that the Open Water Foundation has created for the Poudre, in this case showing precipitation totals over a period. However, I'd like to produce a similar map for streamflow conditions showing percent of median/mean/exceedance probability, etc.
This type of analysis and visualization is complicated by the impact of climate and system change. For example, mean and median will be different depending on the period analyzed. In some visualizations, the full period may be desirable, but in other situations a shorter norming period may be of interest, for example, 30 years.
The server-side solution is perhaps to compute the historical statistics early in the morning and store so that they can be quickly accessed for visualization tools.
This issue will require discussion with the State. It could have great benefits but may be a challenge to fit into the State's backlog.