This repository was archived by the owner on Jan 30, 2024. It is now read-only.
This repository was archived by the owner on Jan 30, 2024. It is now read-only.
Show plot inside original tree cells #11
Description
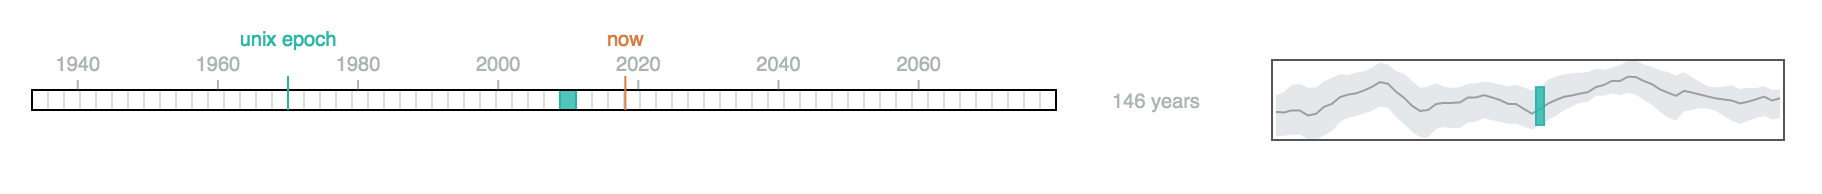
I realized when designing the page that it would present more powerfully if we can start by showing only the root tree node and its 64 cells, then transition to showing the data it represents—by growing the height of the cells to accommodate plotting its mean/min/max inside its cells.
This would unify these views:
It seems to be a good principle to show the data together. This would also simplify the display and code a bit so I can move a bit faster.