Researcher: Bairu Song
Date: February 20, 2026
In systematic botany, the precise classification of species within the same genus often requires more than visual inspection. This study investigates the morphological boundaries of the Iris genus by analyzing biometric data from three species: Setosa, Versicolor, and Virginica. The objective is to determine whether these species exist as distinct clusters in a high-dimensional feature space or if they represent a morphological continuum with significant overlap.
The research follows a systematic Descriptive and Diagnostic framework to evaluate species' traits:
- Distributional Assessment: Quantifying the variance and density of individual traits.
- Correlational Mapping: Identifying linear dependencies between biological measurements.
- Spatial and Functional Projection: Using dimensionality reduction and Fourier-based mapping to visualize high-dimensional relationships that are otherwise inaccessible.
The study utilizes Fisher’s Iris Dataset, which contains 150 total observations (50 per species).
- Variables: Four continuous features—Sepal Length, Sepal Width, Petal Length, and Petal Width—measured in centimeters.
- Integrity: The dataset is balanced, ensuring that statistical observations are not biased toward a specific species.
The investigation was conducted through a four-phase visualization framework, totaling 16 distinct charts to ensure a robust understanding of the data.
Analysis utilized Boxplots and Violin Plots to visualize the median, interquartile range (IQR), and probability density of each trait.
- Finding: Iris setosa demonstrates absolute separation in petal dimensions, suggesting a unique evolutionary path regarding its reproductive structures.
Joint Plots and Pair Plots were employed to map how measurements co-vary.
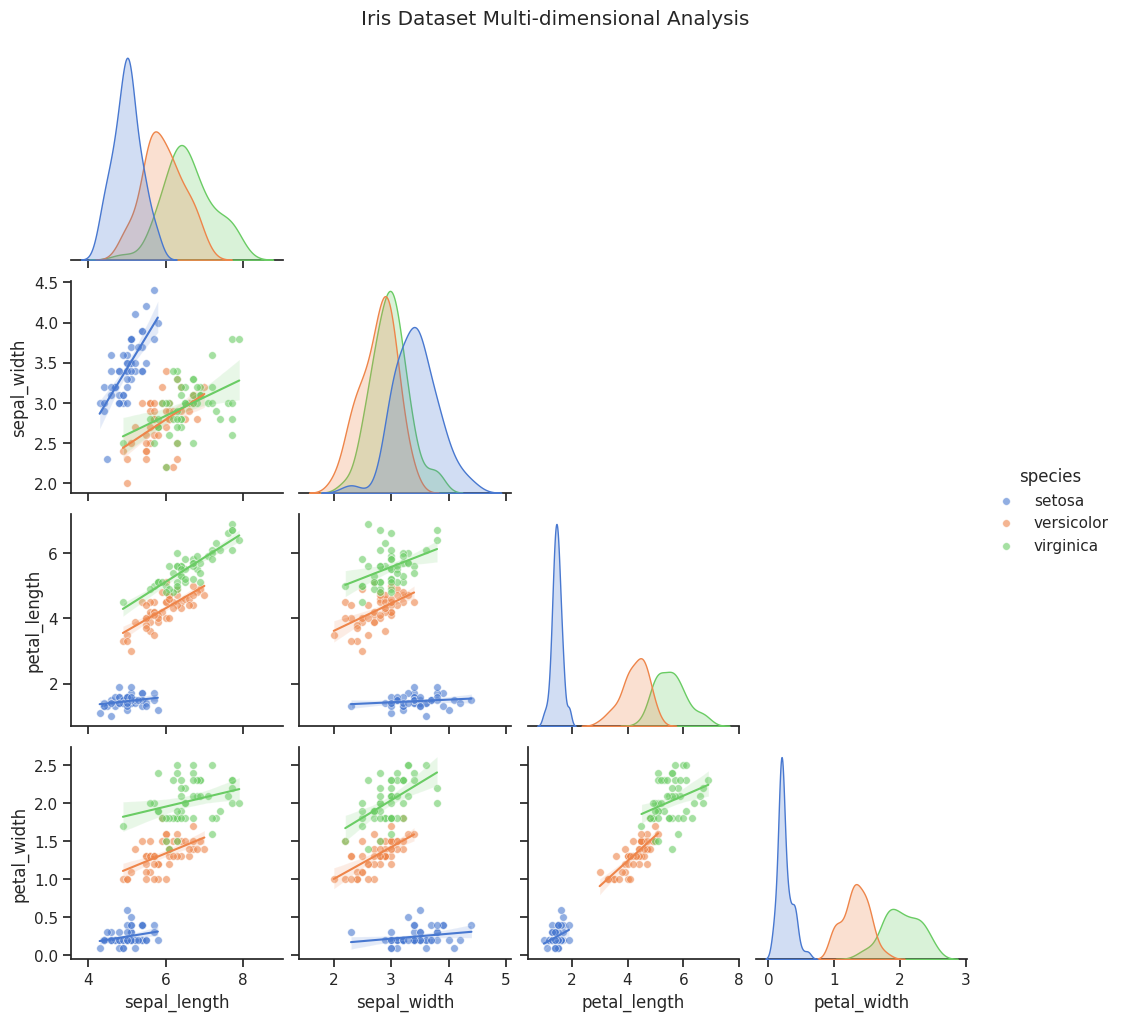
Analysis: The pair plot matrix provides a comprehensive visualization of the 4D feature space. Observations indicate that Iris setosa occupies a distinctly isolated cluster across all petal-related dimensions. Conversely, Iris versicolor and Iris virginica exhibit significant overlap in sepal measurements, though they begin to diverge linearly as petal length increases. This visualization identifies petal characteristics as the primary discriminatory variables for species classification.
-
Quantitative Metric: The relationship between petal length and width was assessed using the Pearson Correlation Coefficient (
$r$ ):
$$r = \frac{\sum (x_i - \bar{x})(y_i - \bar{y})}{\sqrt{\sum (x_i - \bar{x})^2 \sum (y_i - \bar{y})^2}}$$
- Finding: High linear correlation in petals suggests that these traits can be summarized efficiently during dimensionality reduction.
The study applied Heatmaps and Parallel Coordinates to visualize the "closeness" of species clusters.
-
Mathematical Basis: Cluster similarity was quantified using Euclidean Distance (
$L_2$ norm) between species centroids in 4D space:
$$d(\mathbf{p}, \mathbf{q}) = \sqrt{\sum_{i=1}^{n} (p_i - q_i)^2}$$
- Key Finding: Distance matrices confirm that Versicolor and Virginica are mathematical near-neighbors, while Setosa remains geographically isolated.
The final stage employed Principal Component Analysis (PCA) and Andrews Curves for a definitive verdict.
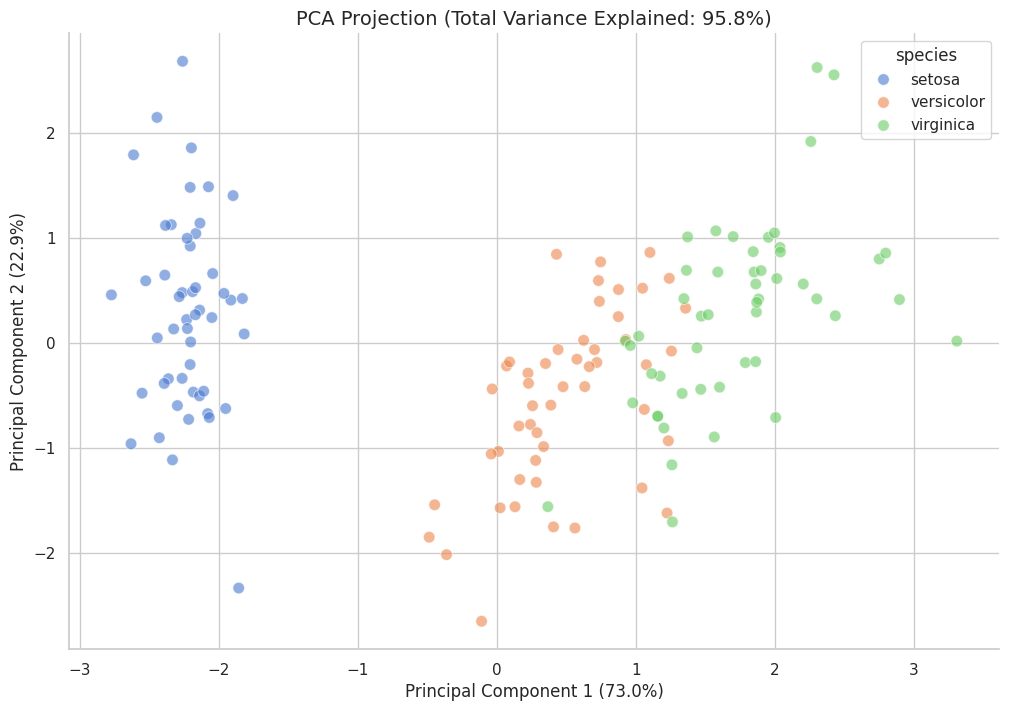
Analysis: The PCA projection captures over 95% of the total variance within the first two principal components. The visualization confirms that while Iris setosa forms a dense, autonomous cluster, a "morphological bridge" exists between Iris versicolor and Iris virginica. This spatial proximity suggests that these two species share highly similar trait ratios, making them mathematically difficult to separate using simple linear boundaries.
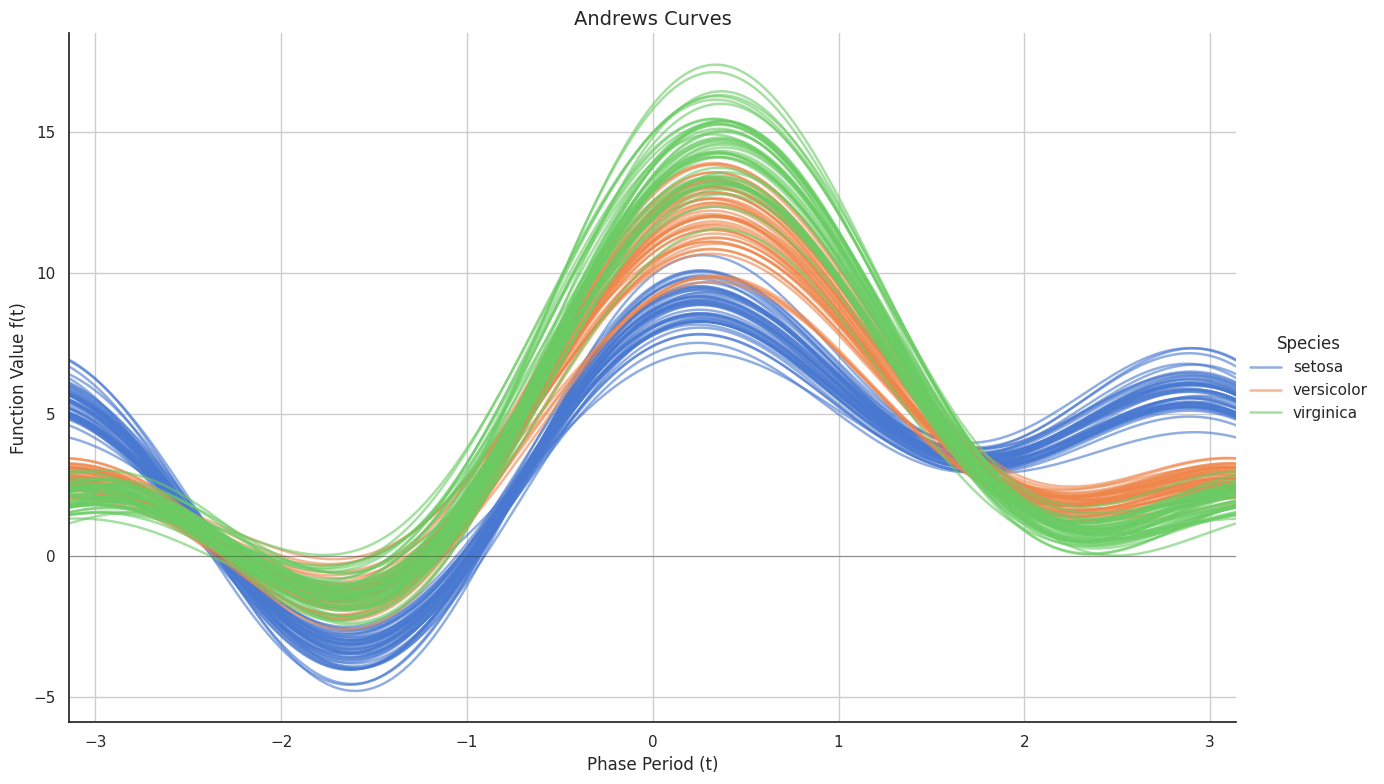
Analysis: Andrews Curves map the multi-dimensional biometric vectors into a functional domain. The resulting waveforms reveal a clear "harmonic" distinction for Iris setosa, while Iris versicolor and Iris virginica display nearly identical phase and frequency patterns. This "phase resonance" suggests that the latter two species share a similar morphological blueprint, confirming their status as near-neighbors in the feature space.
- Functional Transformation: Andrews Curves mapped the 4D vectors into a Fourier series to observe wave-like similarities:
$$f_x(t) = \frac{x_1}{\sqrt{2}} + x_2 \sin(t) + x_3 \cos(t) + x_4 \sin(2t) + \dots$$
- Finding: The "phase resonance" observed between Versicolor and Virginica curves provides conclusive evidence of their morphological convergence.
To prevent features with larger scales (e.g., Sepal Length) from dominating the variance calculations, Standardization (Z-score scaling) was performed. This ensures each trait contributes equally to the distance-based and projection-based algorithms.
$$z = \frac{x - \mu}{\sigma}$$
-
Species Identity: Iris setosa is confirmed as a distinct cluster, easily separable through linear thresholds.
-
Morphological Overlap: Iris versicolor and Iris virginica exhibit a high degree of convergence. While they are distinct species, their mathematical signatures in 4D space are intertwined, suggesting that advanced non-linear classification would be required for perfect accuracy.
-
Conclusion: The 16-chart journey proves that biological classification is a spectrum; data-driven analysis allows for the visualization of this spectrum beyond the limits of human perception.