AF3 ZIP → Standalone HTML Report — a single-file tool that converts AlphaFold3 output ZIP files into beautiful, self-contained HTML reports.
Takes an AlphaFold3 prediction ZIP file and produces a single HTML file containing:
- Input summary — sequences in FASTA format with copy buttons, chain types, lengths
- Confidence overview — all models ranked by
ranking_scorewith ipTM, pTM, fraction disordered, clash status - Chain sequences — full sequences with per-residue pLDDT coloring and interface residue highlighting
- Sequence heatmap strips — linear pLDDT bars with interface position markers
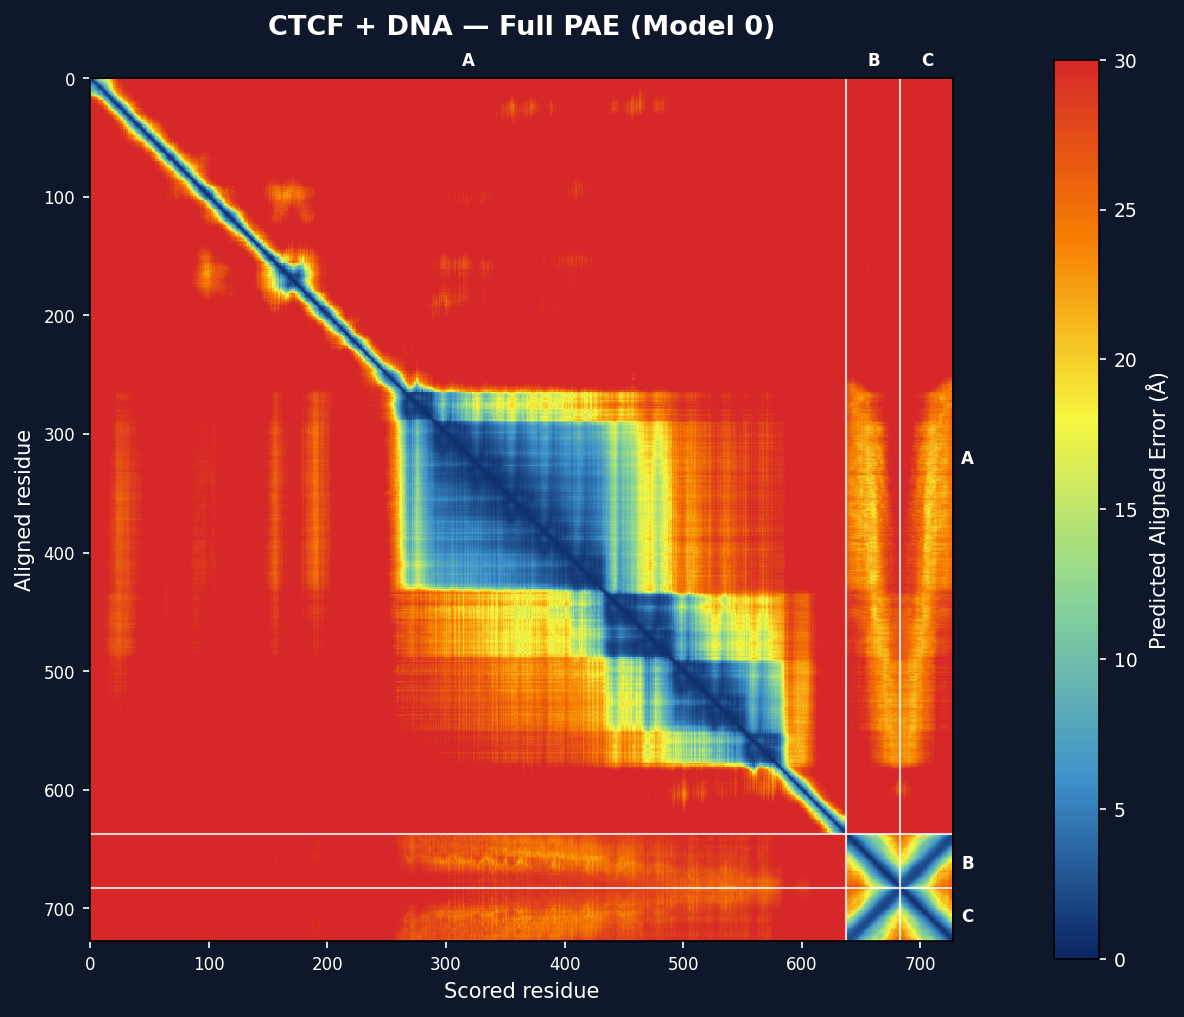
- PAE heatmaps — full predicted aligned error matrices with chain boundaries (embedded as base64 images)
- Interface analysis — inter-chain contacts with residue counts, mean PAE, pLDDT, and high-confidence percentages
- Per-model details — collapsible sections with chain info and interface residue ranges
The HTML is fully standalone — all images are embedded as data URIs, CSS is inline, no external dependencies. Open it in any browser, share via email, or include in presentations.
Works with any AlphaFold3 output: protein homodimers, heterodimers, protein+DNA complexes, multi-chain assemblies.

pip install alpha-fold-viewergit clone https://github.com/aglabx/alpha_fold_viewer.git
cd alpha_fold_viewer
pip install .Requirements: Python 3.8+, numpy, scipy, matplotlib.
# Basic usage — generates fold_ctcf_report.html
af3-report fold_ctcf_dimer.zip

# Custom output path
af3-report fold_ctcf_dimer.zip -o ctcf_report.html

# Stricter contact distance (default: 8.0 Å)
af3-report fold_ctcf_dimer.zip --contact-dist 6.0

# Keep extracted temp files for debugging
af3-report fold_ctcf_dimer.zip --keep-tmp

# Also works as a Python script
python af3_report.py fold_ctcf_dimer.zipaf3-report INPUT_ZIP [-o OUTPUT_HTML] [--contact-dist 8.0] [--keep-tmp]
Positional:
INPUT_ZIP Path to AlphaFold3 output ZIP file
Options:
-o, --output Output HTML file (default: {zip_name}_report.html)
--contact-dist Inter-atomic contact threshold in Å (default: 8.0)
--keep-tmp Keep extracted temporary files
Models are sorted by ranking_score (highest first). The best model is highlighted in green. Columns:
| Column | Description |
|---|---|
| Ranking Score | AF3 composite confidence metric (higher = better) |
| ipTM | Interface predicted TM-score (0–1, higher = better interface) |
| pTM | Predicted TM-score for overall structure |
| Frac. Disordered | Fraction of residues predicted as disordered |
| Clash | Whether the model has steric clashes |
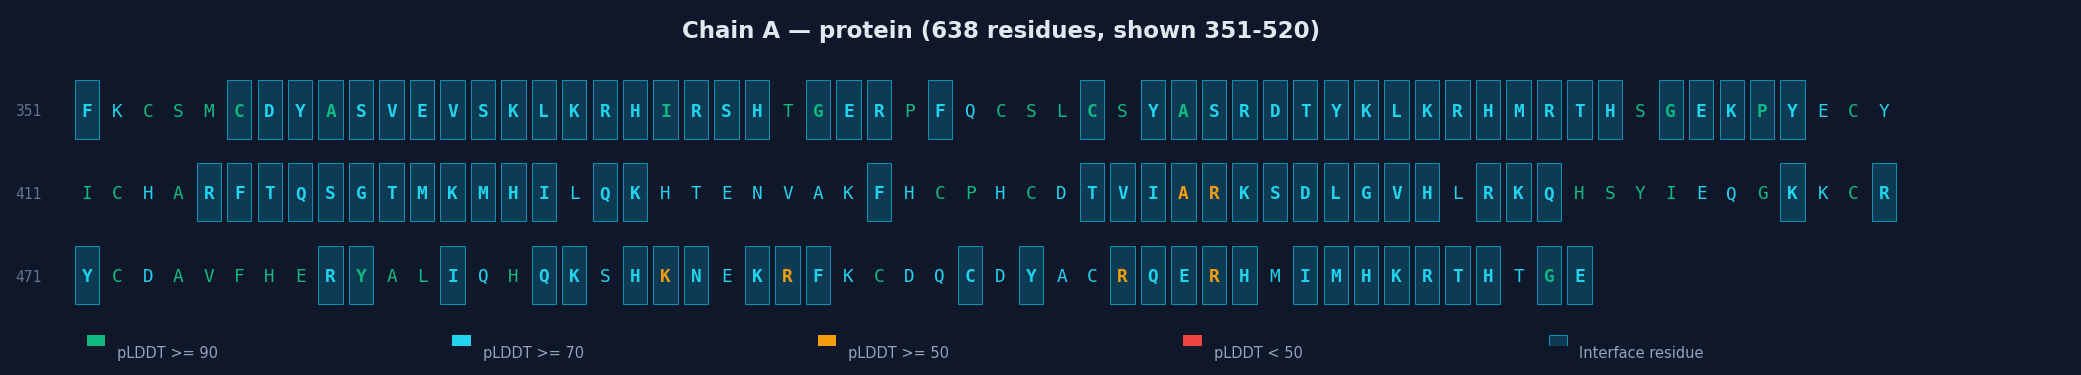
Each chain is displayed with:
- Full sequence colored by per-residue pLDDT (green ≥90, cyan ≥70, yellow ≥50, red <50)
- Interface residues highlighted with cyan background
- Linear heatmap strip showing pLDDT along the sequence with interface markers
For multi-chain models, inter-chain contacts are detected using a KDTree spatial search. Each interface reports:
| Metric | Description |
|---|---|
| Res. A / Res. B | Number of residues at the interface per chain |
| Atom Contacts | Total inter-chain atom pairs within contact distance |
| pLDDT A / pLDDT B | Mean predicted local confidence at interface residues |
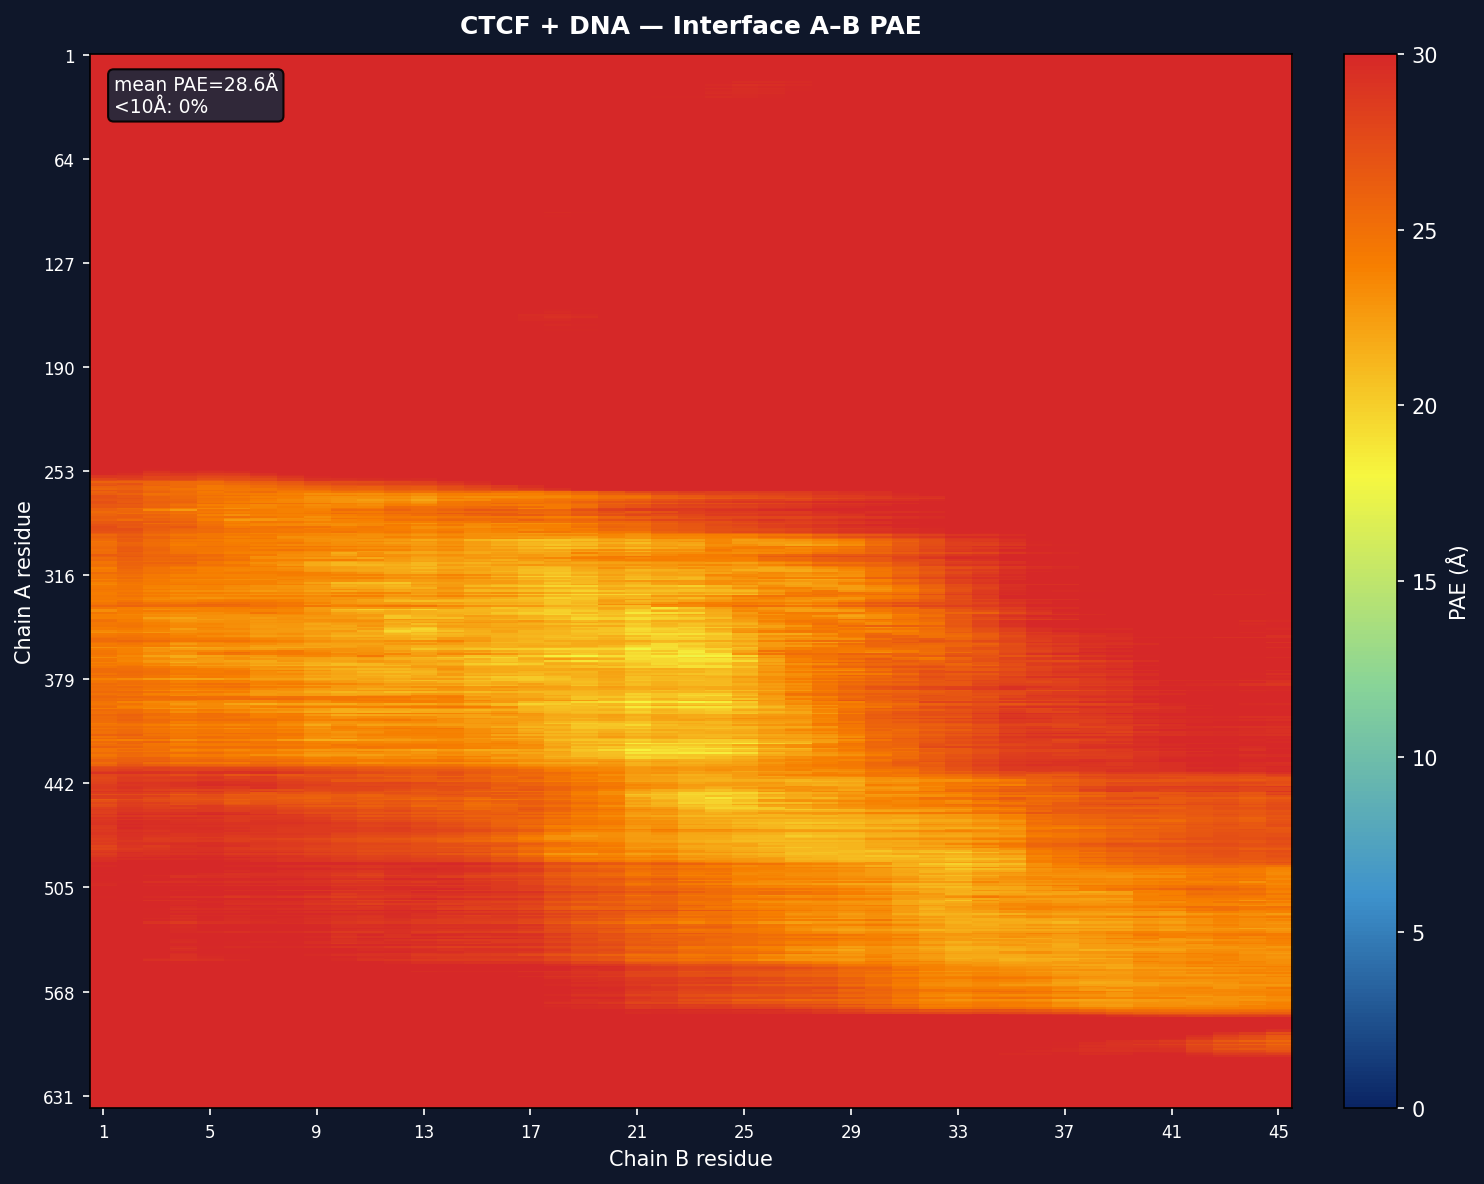
| Avg PAE | Mean predicted aligned error across interface residue pairs |
| PAE <10Å | Percentage of PAE values below 10Å (higher = more confident) |
| High-conf | Percentage of contacts where both atoms have pLDDT ≥ 70 |
Each model gets a full PAE matrix heatmap with chain boundary lines. The colormap runs from dark blue (low PAE = high confidence) through green/yellow to red (high PAE = low confidence). Scale: 0–30 Å.
For multi-chain models, per-interface sub-matrices are also shown with mean PAE and <10Å percentage annotations.
- Extracts the AF3 ZIP to a temporary directory
- Auto-discovers model files (
*_model_*.cif,*_full_data_*.json,*_summary_confidences_*.json) - Parses mmCIF structures to extract atom coordinates, chain IDs, pLDDT values
- Loads PAE matrices from full_data JSONs
- Detects inter-chain interfaces using scipy KDTree
- Cross-references interfaces with PAE data
- Generates PAE heatmaps in-memory using matplotlib (→ base64 PNGs)
- Assembles everything into a single standalone HTML file
MIT