Sgvizler is a javascript wrapper for easy visualisation of SPARQL result sets.
See http://mgskjaeveland.github.io/sgvizler/ for how to set up, use, and extend Sgvizler, including documentation, downloads, and examples.
How to install Sgvizler :
I) Clone the project from Github :
"https://github.com/mgskjaeveland/sgvizler.git"
II) Install these programs :
i) Nodejs : "sudo apt install nodejs-legacy"
(for Ubuntu 16.04 this installed version is not up to date, to get the last version : https://askubuntu.com/questions/786272/why-does-installing-node-6-x-on-ubuntu-16-04-actually-install-node-4-2-6)
ii) "npm install -g npm"

iii) Yuidocjs : "npm -g install yuidocjs."

iv) "npm install uglify-js -g"
III) Setup :
i) Type : "yuidoc." at the source of the tree.
This will generate a ./out directory

ii) Being in ./sgvizler, type "make sgvizler.js"
This will create all necessary files thanks to Makefile

iii) Finally, type "uglifyjs sgvizler.js -o sgvizler.min.js"
To get the minifier version of sgvizler.js
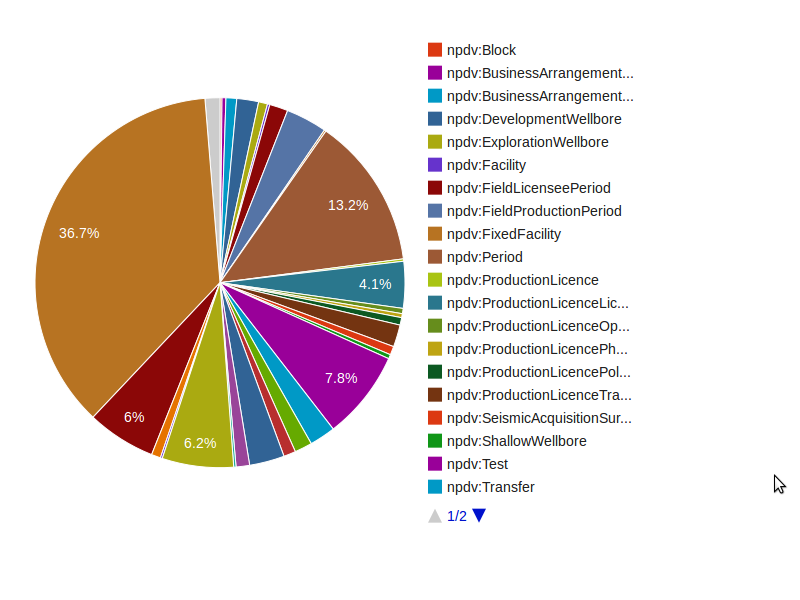
Add visualisations directly into your webpages like this:
<div id="example"
     data-sgvizler-endpoint="http://sws.ifi.uio.no/sparql/npd"
     data-sgvizler-query="SELECT ?class (count(?instance) AS ?noOfInstances)
                          WHERE{ ?instance a ?class }
                          GROUP BY ?class
                          ORDER BY ?class"
     data-sgvizler-chart="google.visualization.PieChart"
     style="width:800px; height:400px;"></div>
to get charts like this: