

synloc is an open-source Python package implementing the Local Resampler (LR) algorithm for generating synthetic tabular data while safeguarding privacy. It provides a computationally efficient and flexible approach to synthetic data generation, enabling researchers to work with privacy-preserving datasets that maintain statistical utility.
Both approaches provide effective disclosure control. Choose based on your priorities:
| Approach | Best for | Key advantage |
|---|---|---|
| k-Nearest Neighbors (k-NN) | Stronger disclosure control | Naturally underrepresents outliers, reducing privacy risks |
| Clustering-based | Efficiency & accuracy | Better data utility and computational performance |
Key features:
- Natural disclosure risk reduction by underrepresenting outliers (k-NN variant)
- Accurate replication of complex distributions, including multimodal and non-convex-support data
- Flexible trade-off between data utility and privacy protection
- Compatible with parametric and nonparametric distributions
This implementation aligns with statistical agencies' safe data regulations, including the k-anonymity criterion and the Five Safes framework adopted by organizations such as the Australian Bureau of Statistics. For the full methodology and theoretical foundations, see the paper referenced below.
synloc can be installed through PyPI:
pip install synloc
Assume that we have a sample with three variables with the following distributions:
The distribution can be generated by tools module in synloc:
from synloc.tools import sample_trivariate_xyz
data = sample_trivariate_xyz() # Generates a sample with size 1000 by default.
Initializing the resampler:
from synloc import LocalCov
resampler = LocalCov(data = data, K = 30)
Subsample size is defined as K=30. Now, we locally estimate the multivariate normal distribution and from each estimated distributions we draw "synthetic values."
syn_data = resampler.fit() 100%|██████████| 1000/1000 [00:01<00:00, 687.53it/s]
syn_data is a pandas.DataFrame where all variables are synthesized. Comparing the original sample using a 3-D Scatter:
resampler.comparePlots(['x','y','z'])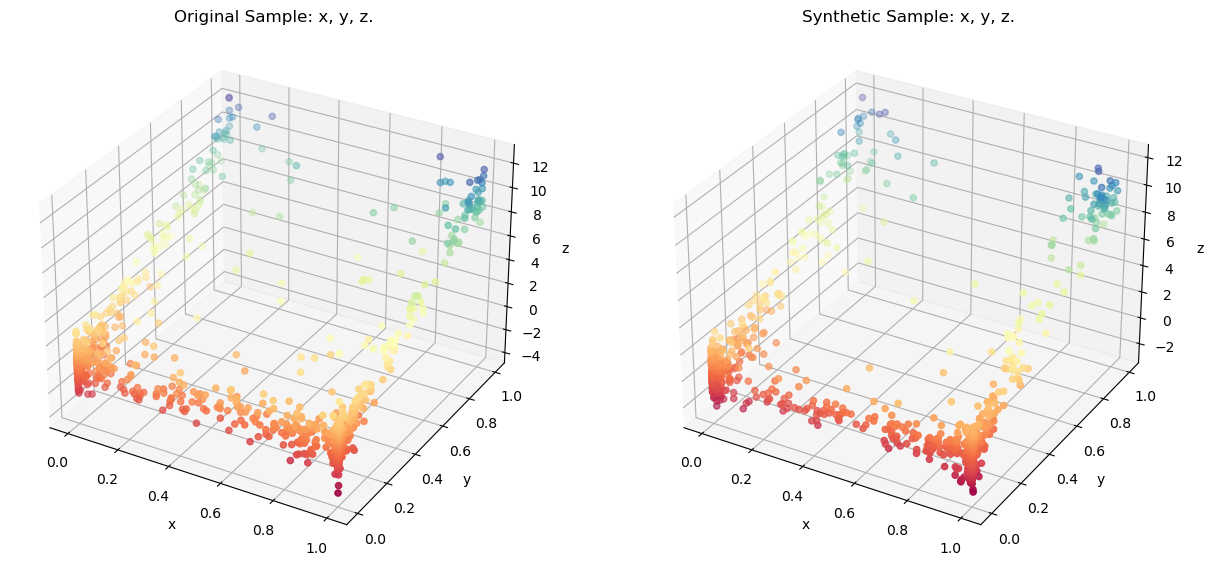
If you use synloc in your research, please cite the following paper:
@article{kalay2025generating,
  author    = {Kalay, Ali Furkan},
  title     = {Generating Synthetic Data With Locally Estimated Distributions for Disclosure Control},
  journal   = {Australian \& New Zealand Journal of Statistics},
  year      = {2025},
  volume    = {n/a},
  number    = {n/a},
  keywords  = {clustering algorithms, computational statistics, k-nearest neighbours, statistical disclosure control, synthetic data},
  doi       = {10.1111/anzs.70032},
  url       = {https://onlinelibrary.wiley.com/doi/abs/10.1111/anzs.70032}
}For replication materials of the paper, see the replication folder.