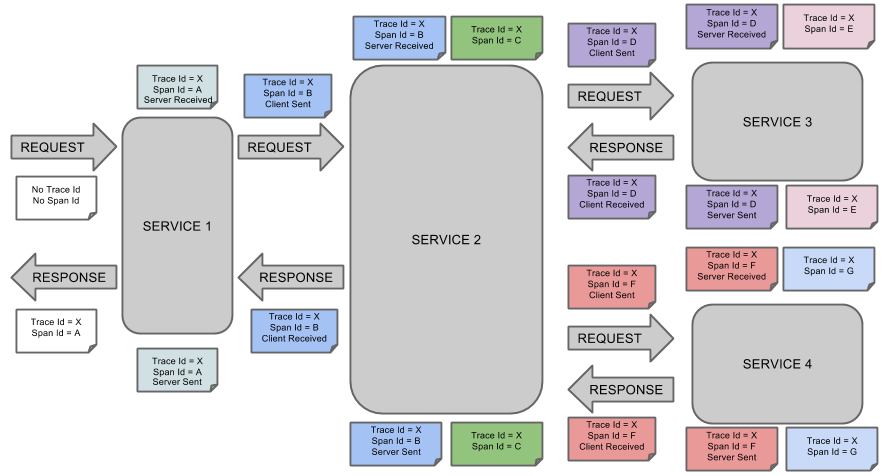
The OpenTelemetry Demo is a complete, production-like microservices application that demonstrates how modern observability works using:
- Distributed Tracing
- Metrics Collection
- Logs Correlation
- OpenTelemetry Collector Pipelines
- Visualization in Grafana + Jaeger
It is intentionally polyglot (many languages) and multi-service to simulate real-world cloud architectures.
User → Frontend → Envoy → Microservices → OTel Collector → Observability Backends
- 4–8 GB RAM
- Any OS (Linux / macOS / Windows)
- Docker + Docker Compose or
- Kubernetes + Helm
- Kubectl
- Internet access to pull images
- Grafana
- Jaeger
- Prometheus
- OpenSearch
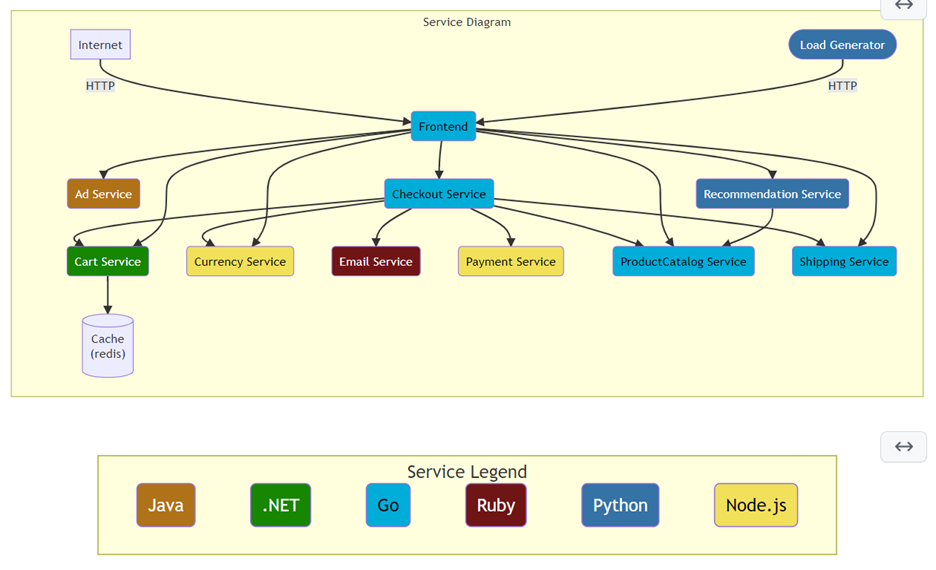
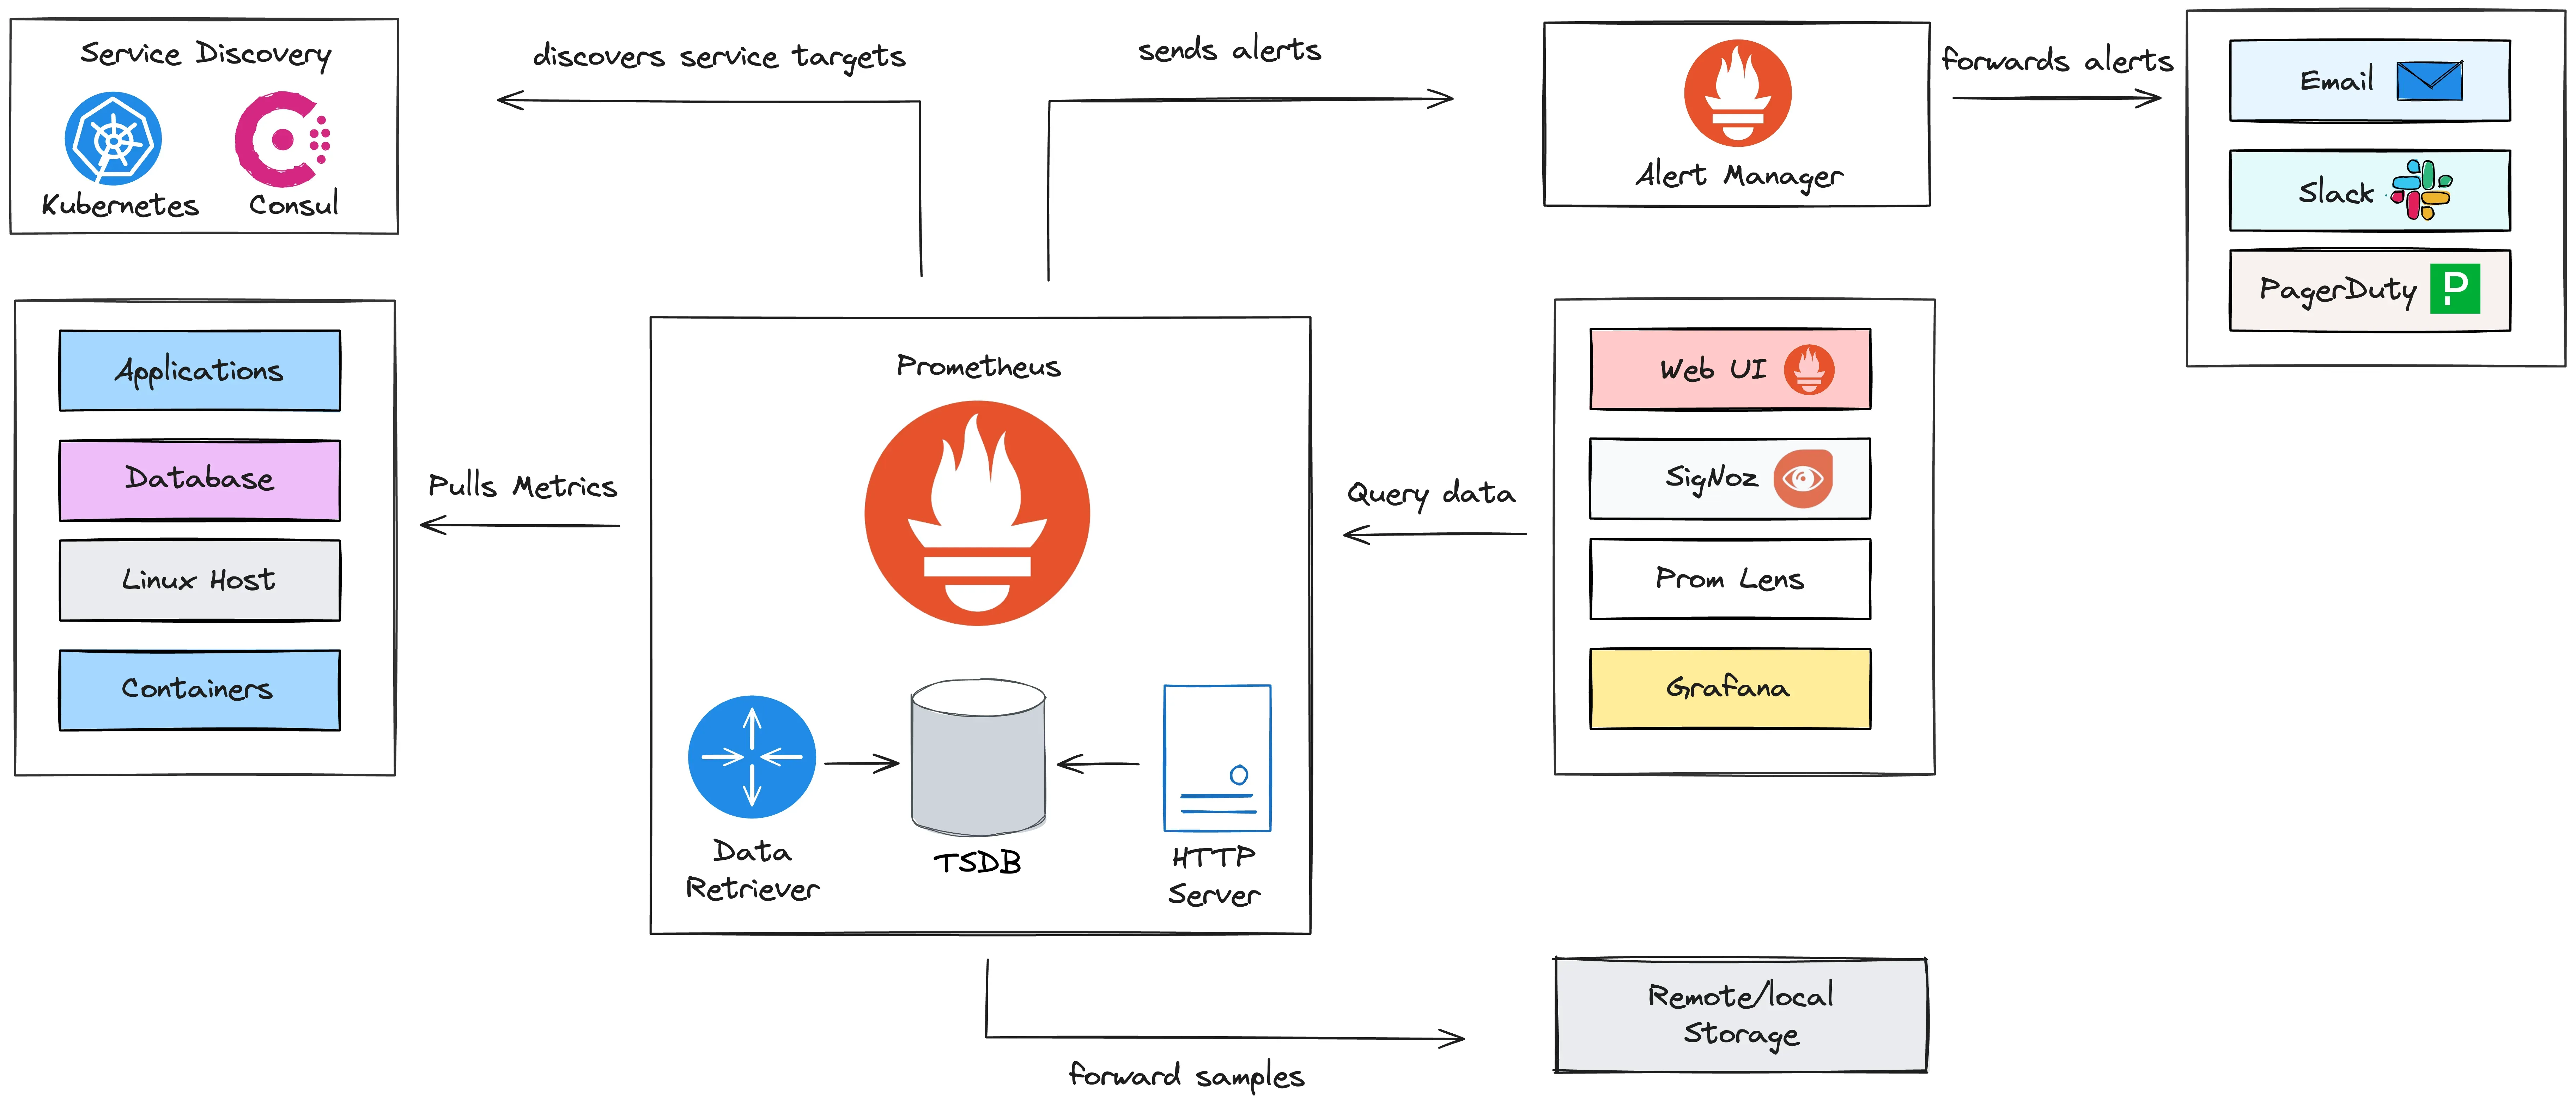
Here is a visual understanding of the system structure:
+---------------------------+
| Web & Mobile Clients |
+---------------------------+
|
v
+-----------------------------------+
| Envoy Frontend Proxy |
+-----------------------------------+
|
v
+---------------- Backend ----------------+
| Product Catalog | Cart | Checkout |
| Payment | Shipping |
| Recommendation | Ads |
| Currency | Fraud Detection |
| Accounting | Email |
| Image Provider | ... |
+----------------------------------------+
|
+---------------------+
| Redis / Kafka |
+---------------------+
|
v
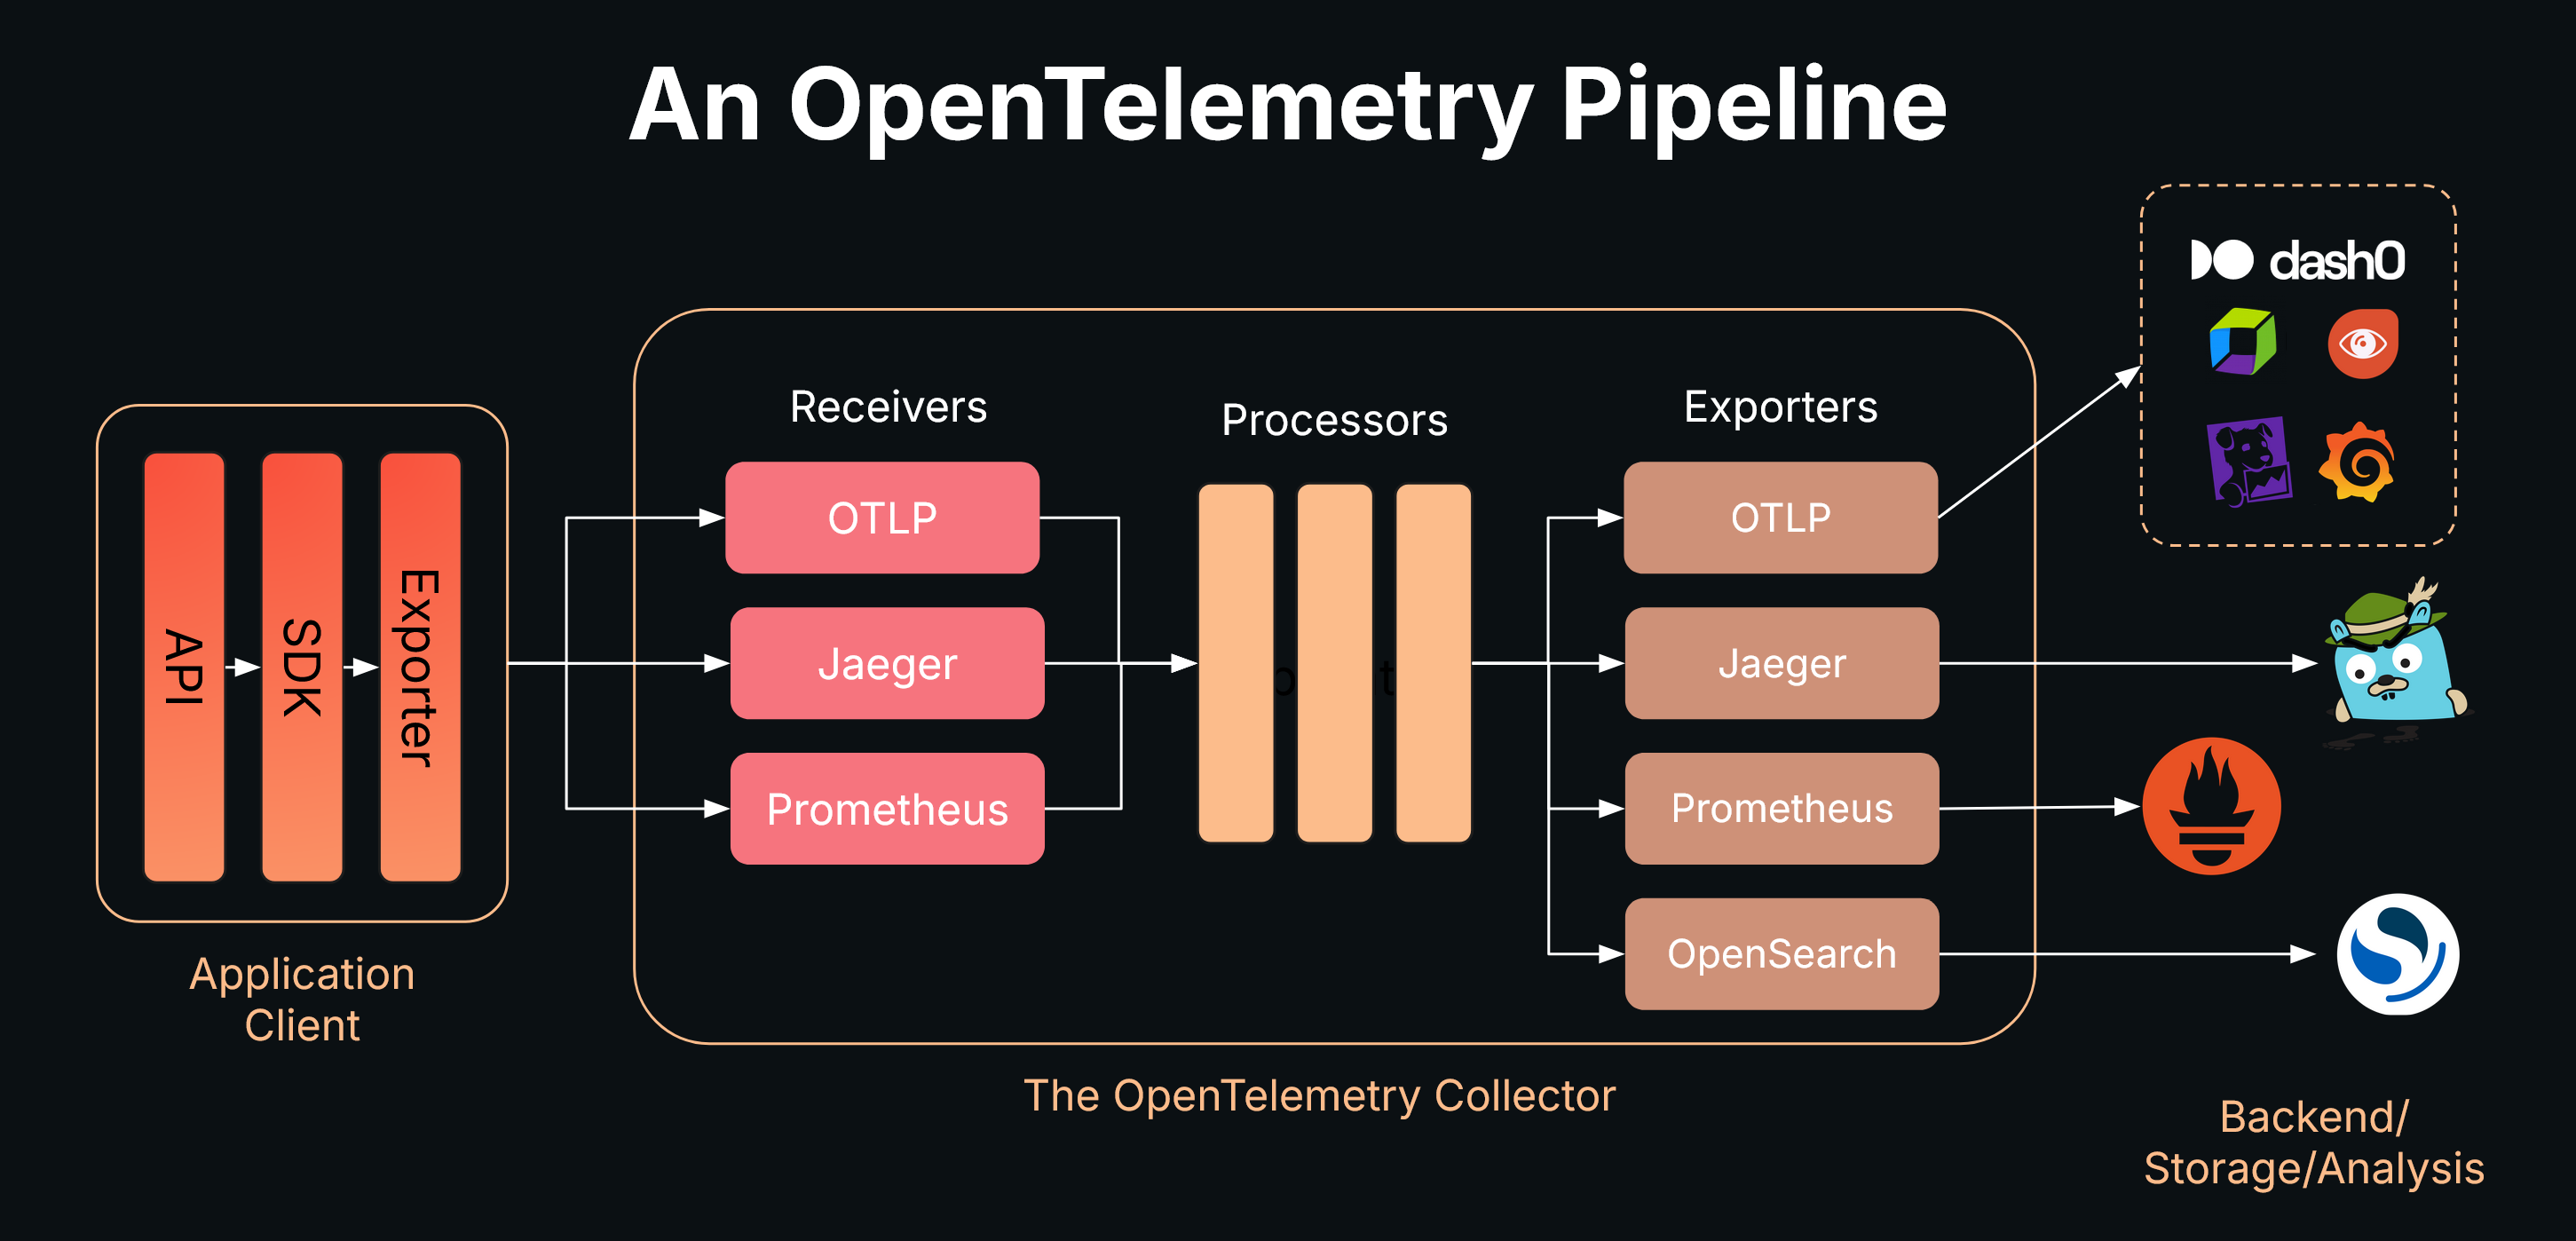
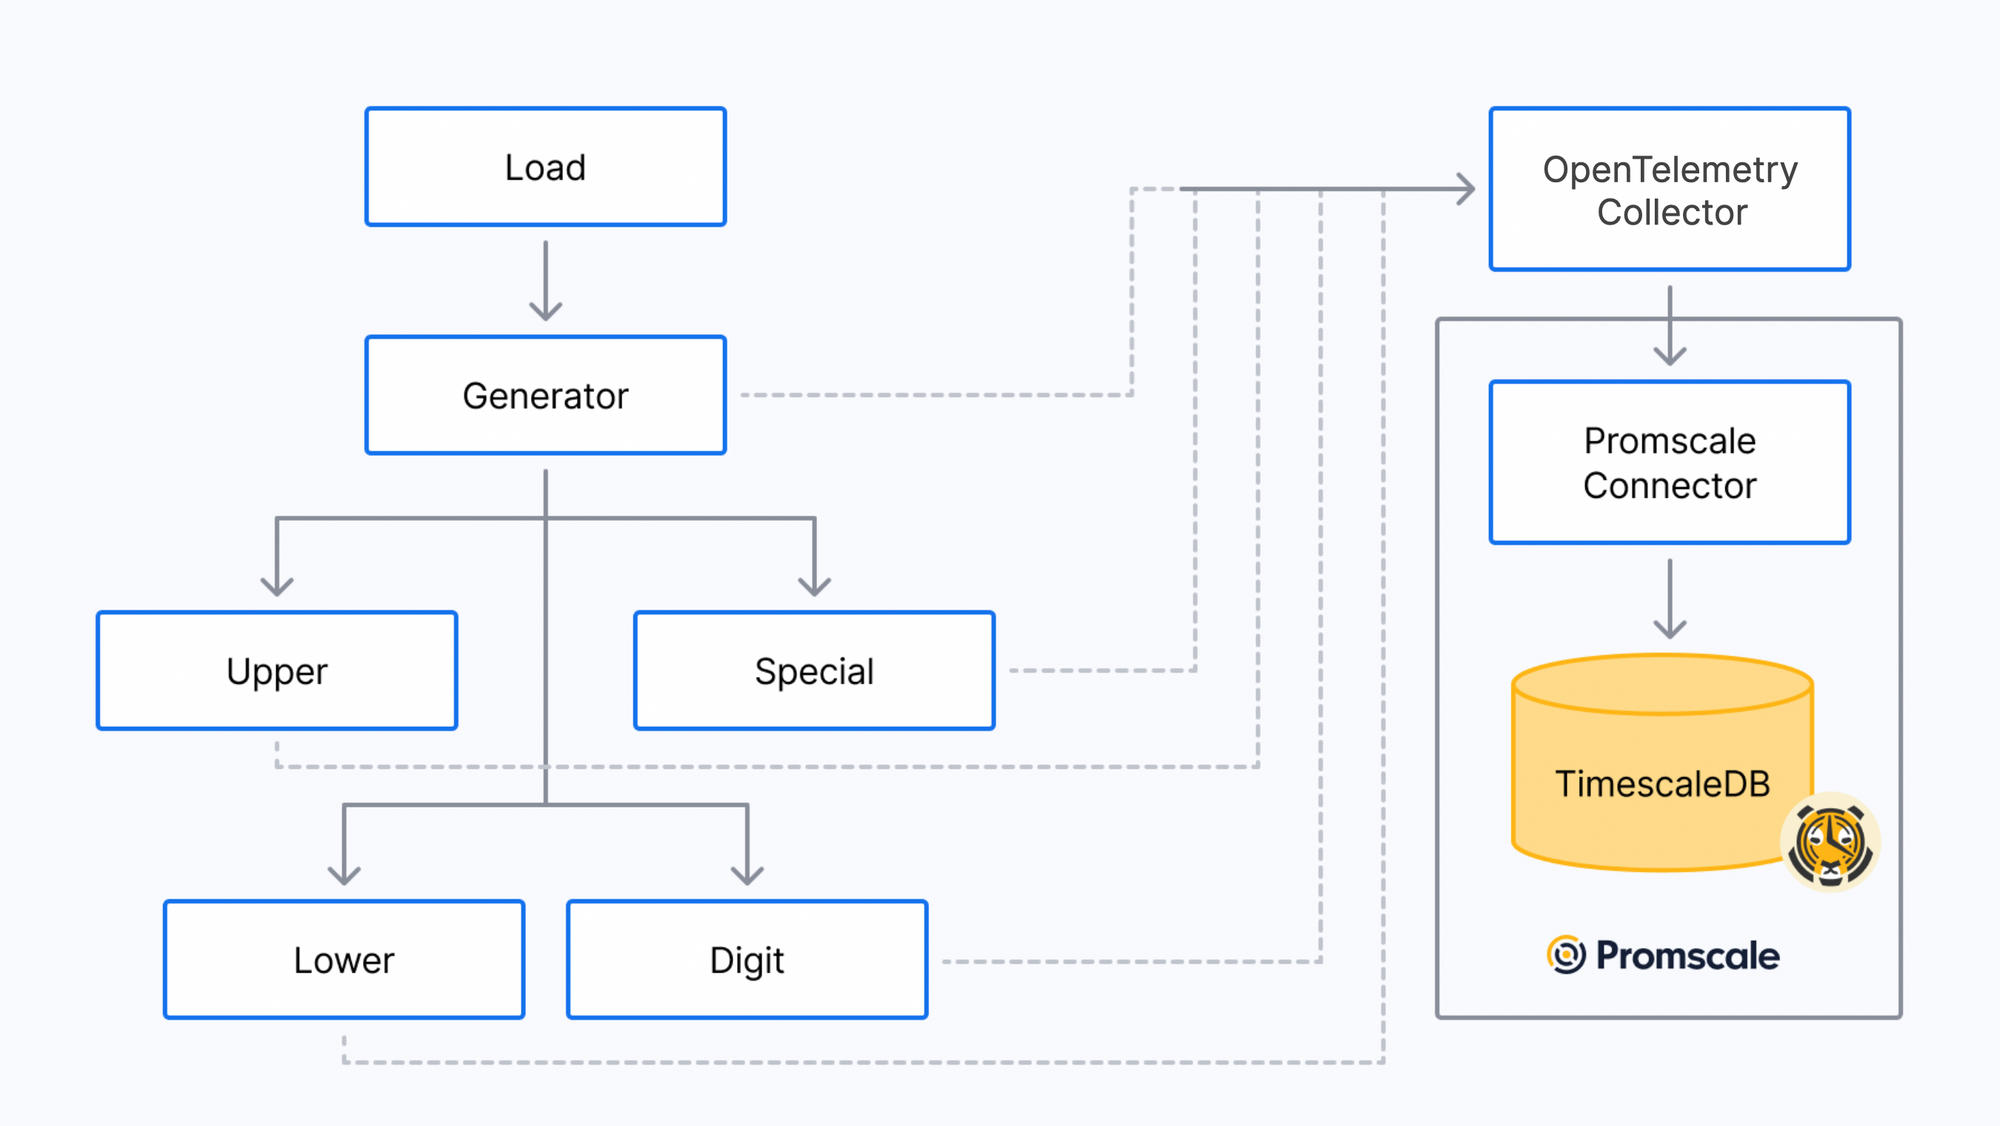
+----------------------------------------+
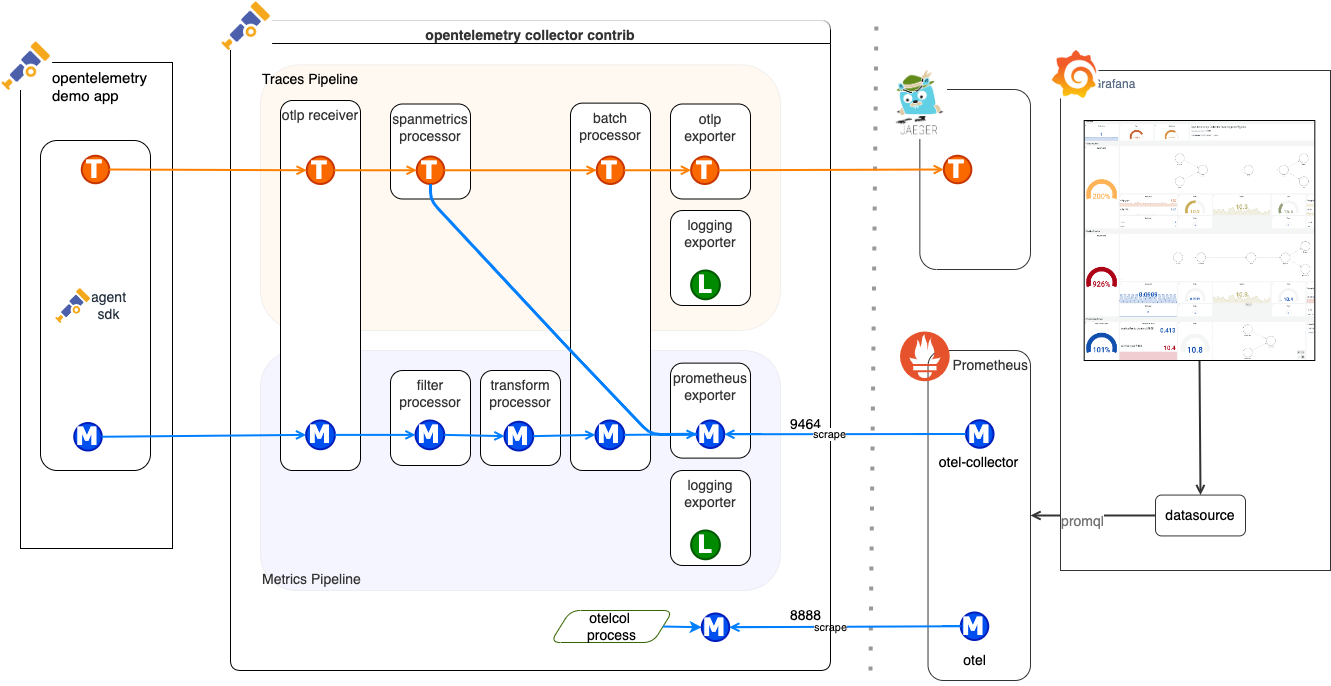
| OpenTelemetry Collector |
| (Receives → Processes → Exports) |
+----------------------------------------+
|
v
+----------------------------------------+
| Prometheus | Jaeger | Logs Backend |
+----------------------------------------+
|
v
+---------------+
| Grafana |
+---------------+
Below are visuals + explanations for each backend service type.

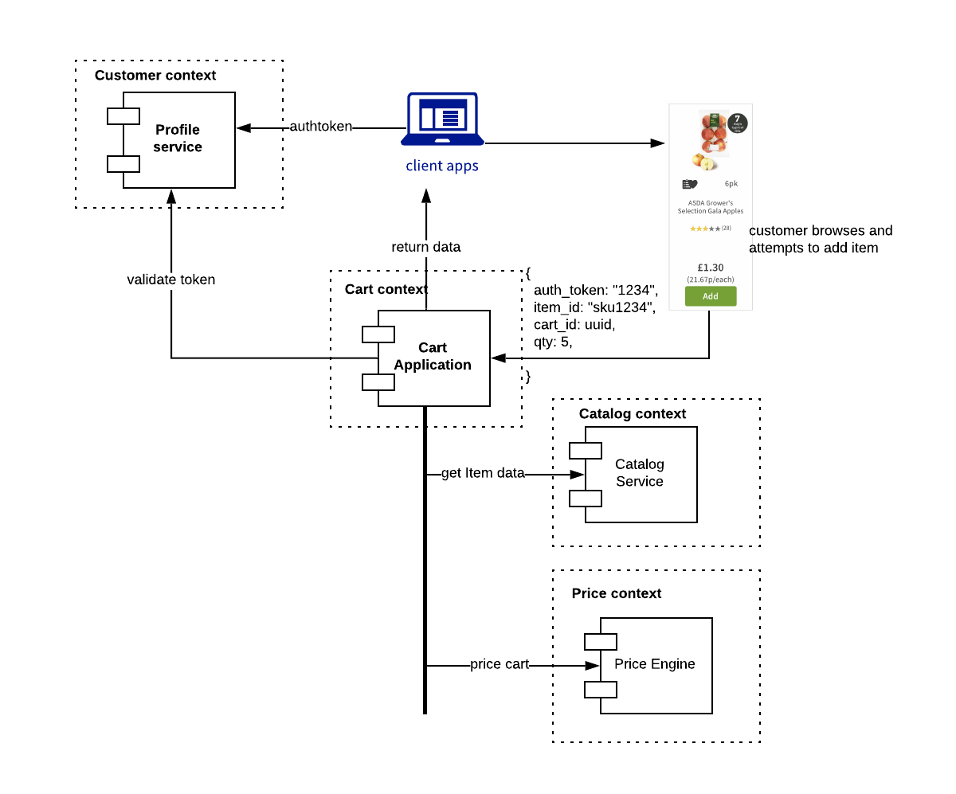
Purpose Handles the user’s cart state:
- Add items
- Update quantities
- Remove items
- Calculate totals
Data Storage
- Uses Redis/Valkey for fast, real-time cart access.
Observability (OTel)
- Spans for every cart action
- Metrics for request count, latency, and errors
- Logs correlated with trace IDs
Example Trace (high-level)
Add Item → Redis Command → Response → Export Trace

Purpose
- Validate and authorize payments
- Interact with mock gateway
- Publish events to Kafka
- Participate in fraud-detection workflow
Observability
-
Span example:
"payment.authorize" -
Attributes tracked:
- Amount
- Currency
- Payment result
-
Errors captured and linked to same trace
-
Metrics: success rate, latency distribution
Simplified Flow
Checkout → Payment → Kafka Event → Fraud Detection → Checkout Response

Purpose
-
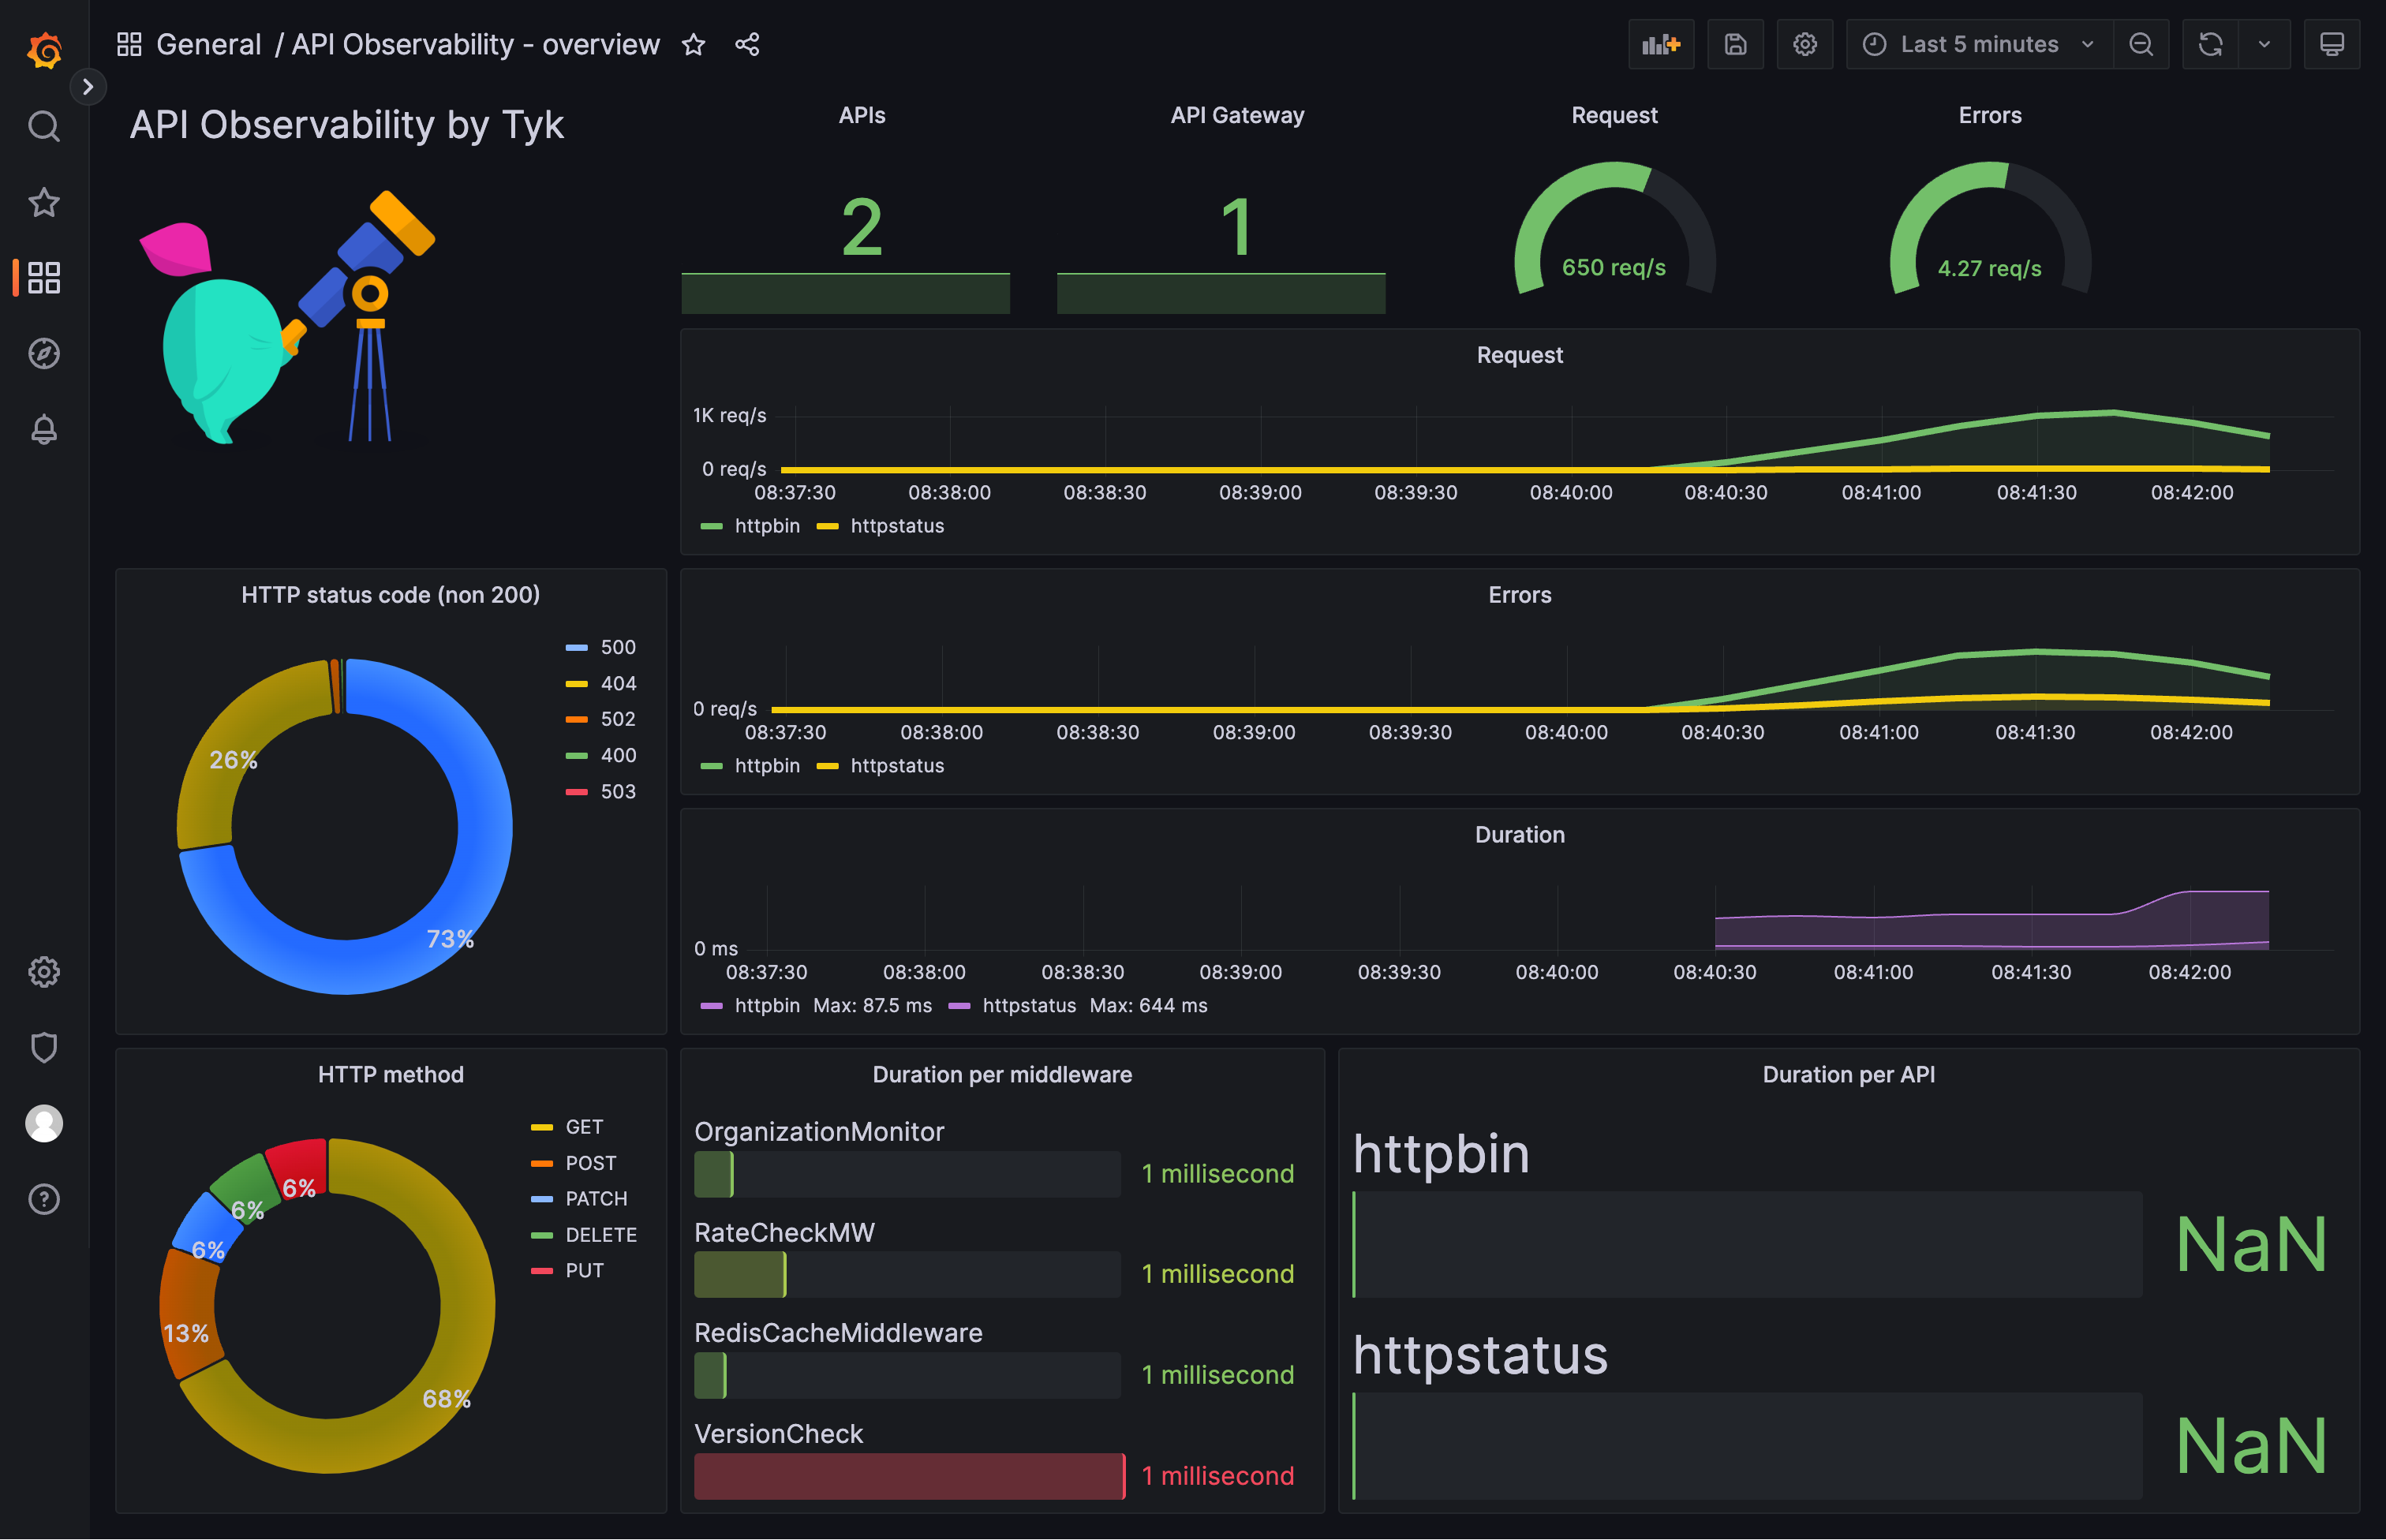
Scrapes metrics from the OpenTelemetry Collector
-
Stores time-series data for:
- Latency
- Request Volume
- Error Rates
- CPU / Memory Usage
Why It Matters
Prometheus allows the system to answer questions like:
- “What is the P95 latency of Checkout?”
- “Is the Cart error rate increasing?”
- “Did the new deployment slow down the Payment Service?”
Purpose
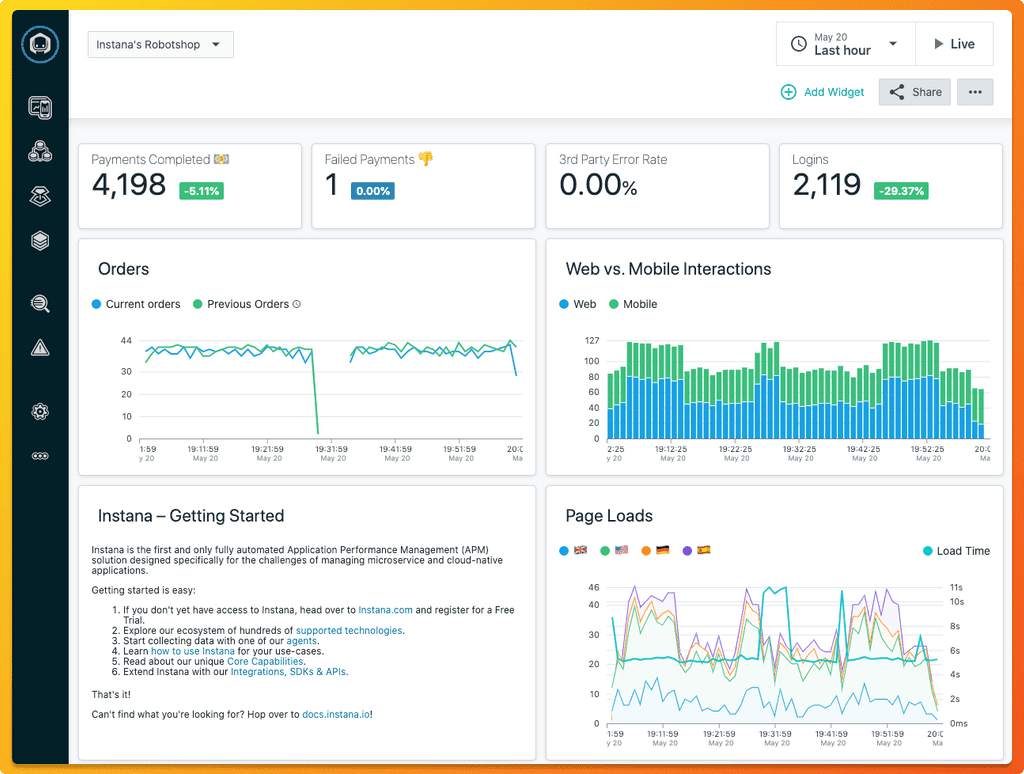
Grafana is the central UI for:
- Metrics (Prometheus)
- Traces (Jaeger)
- Logs (OpenSearch, Loki, etc.)
Capabilities
- Build performance dashboards
- Drill down from a spike → specific trace → related logs
- Combine business and technical metrics in one view
The OpenTelemetry Demo aims to:
Provide an end-to-end, realistic example of distributed tracing, metrics, and logging.
Demonstrate how modern cloud-native systems should integrate OpenTelemetry.
Allow teams to:
- Test new exporters
- Experiment with collector pipelines
- Validate service instrumentation patterns
A vendor-neutral environment for backend compatibility testing.