Generates a set of plots showing ubiome data over time.
Genus Heatmap


![Alt text] (https://raw.githubusercontent.com/isaacgerg/ubiome_longitudinal_analysis/master/sample_data/bottom%2010%20species%20percent%20of%20sample%20-%20stacked.png "bottom 10 species percent of sample - stacked")
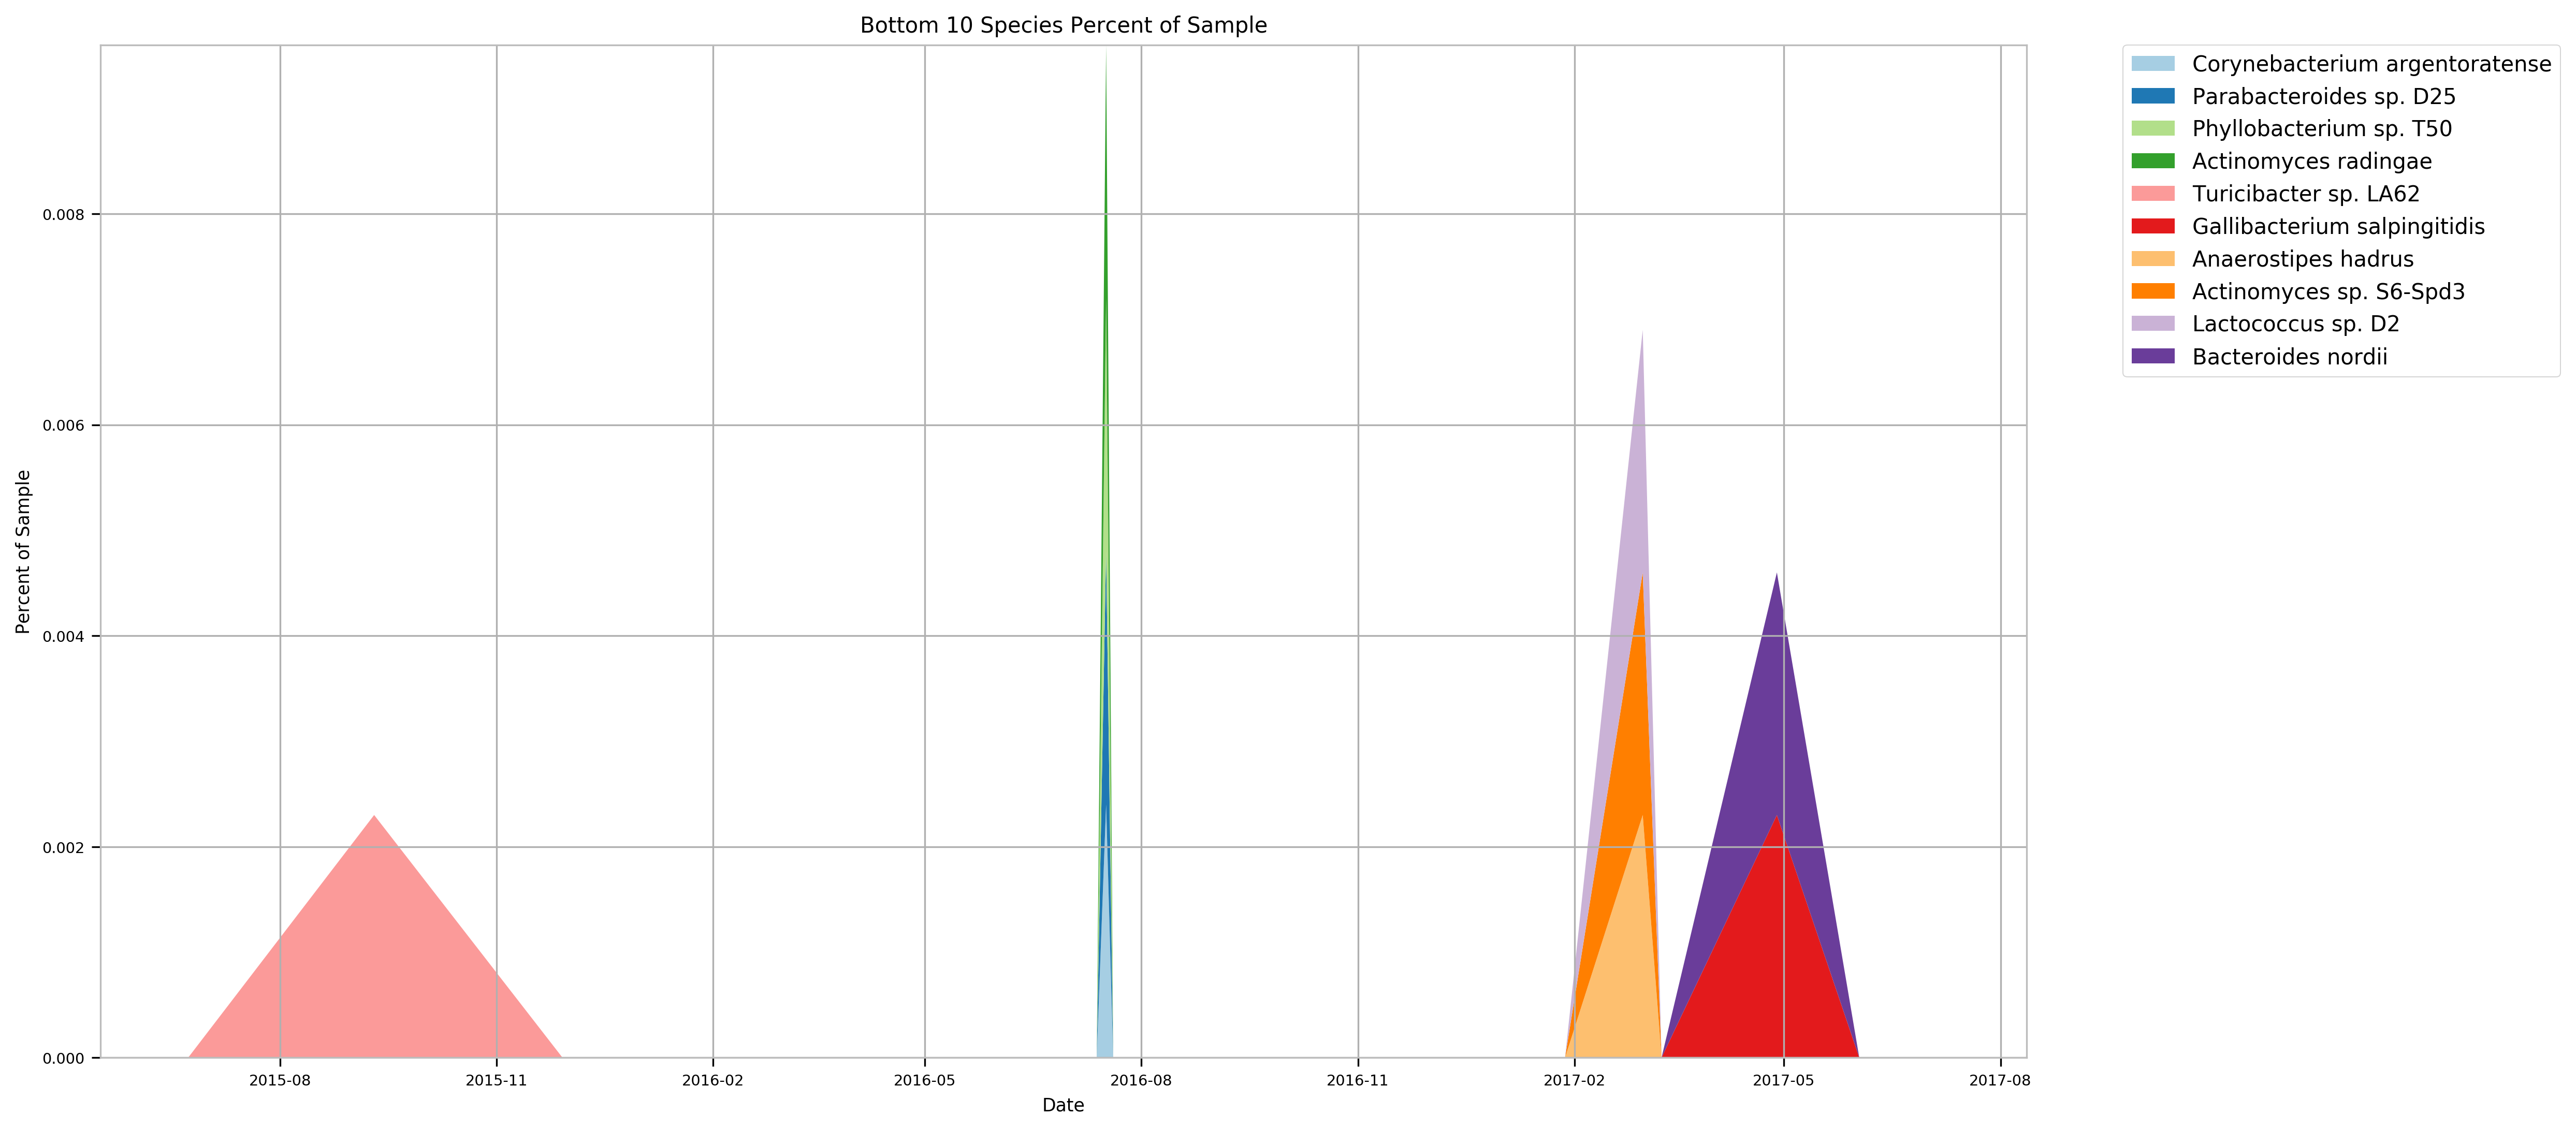
![Alt text] (https://raw.githubusercontent.com/isaacgerg/ubiome_longitudinal_analysis/master/sample_data/family%20similarity%20to%20median.png "Family Similarity to Median")
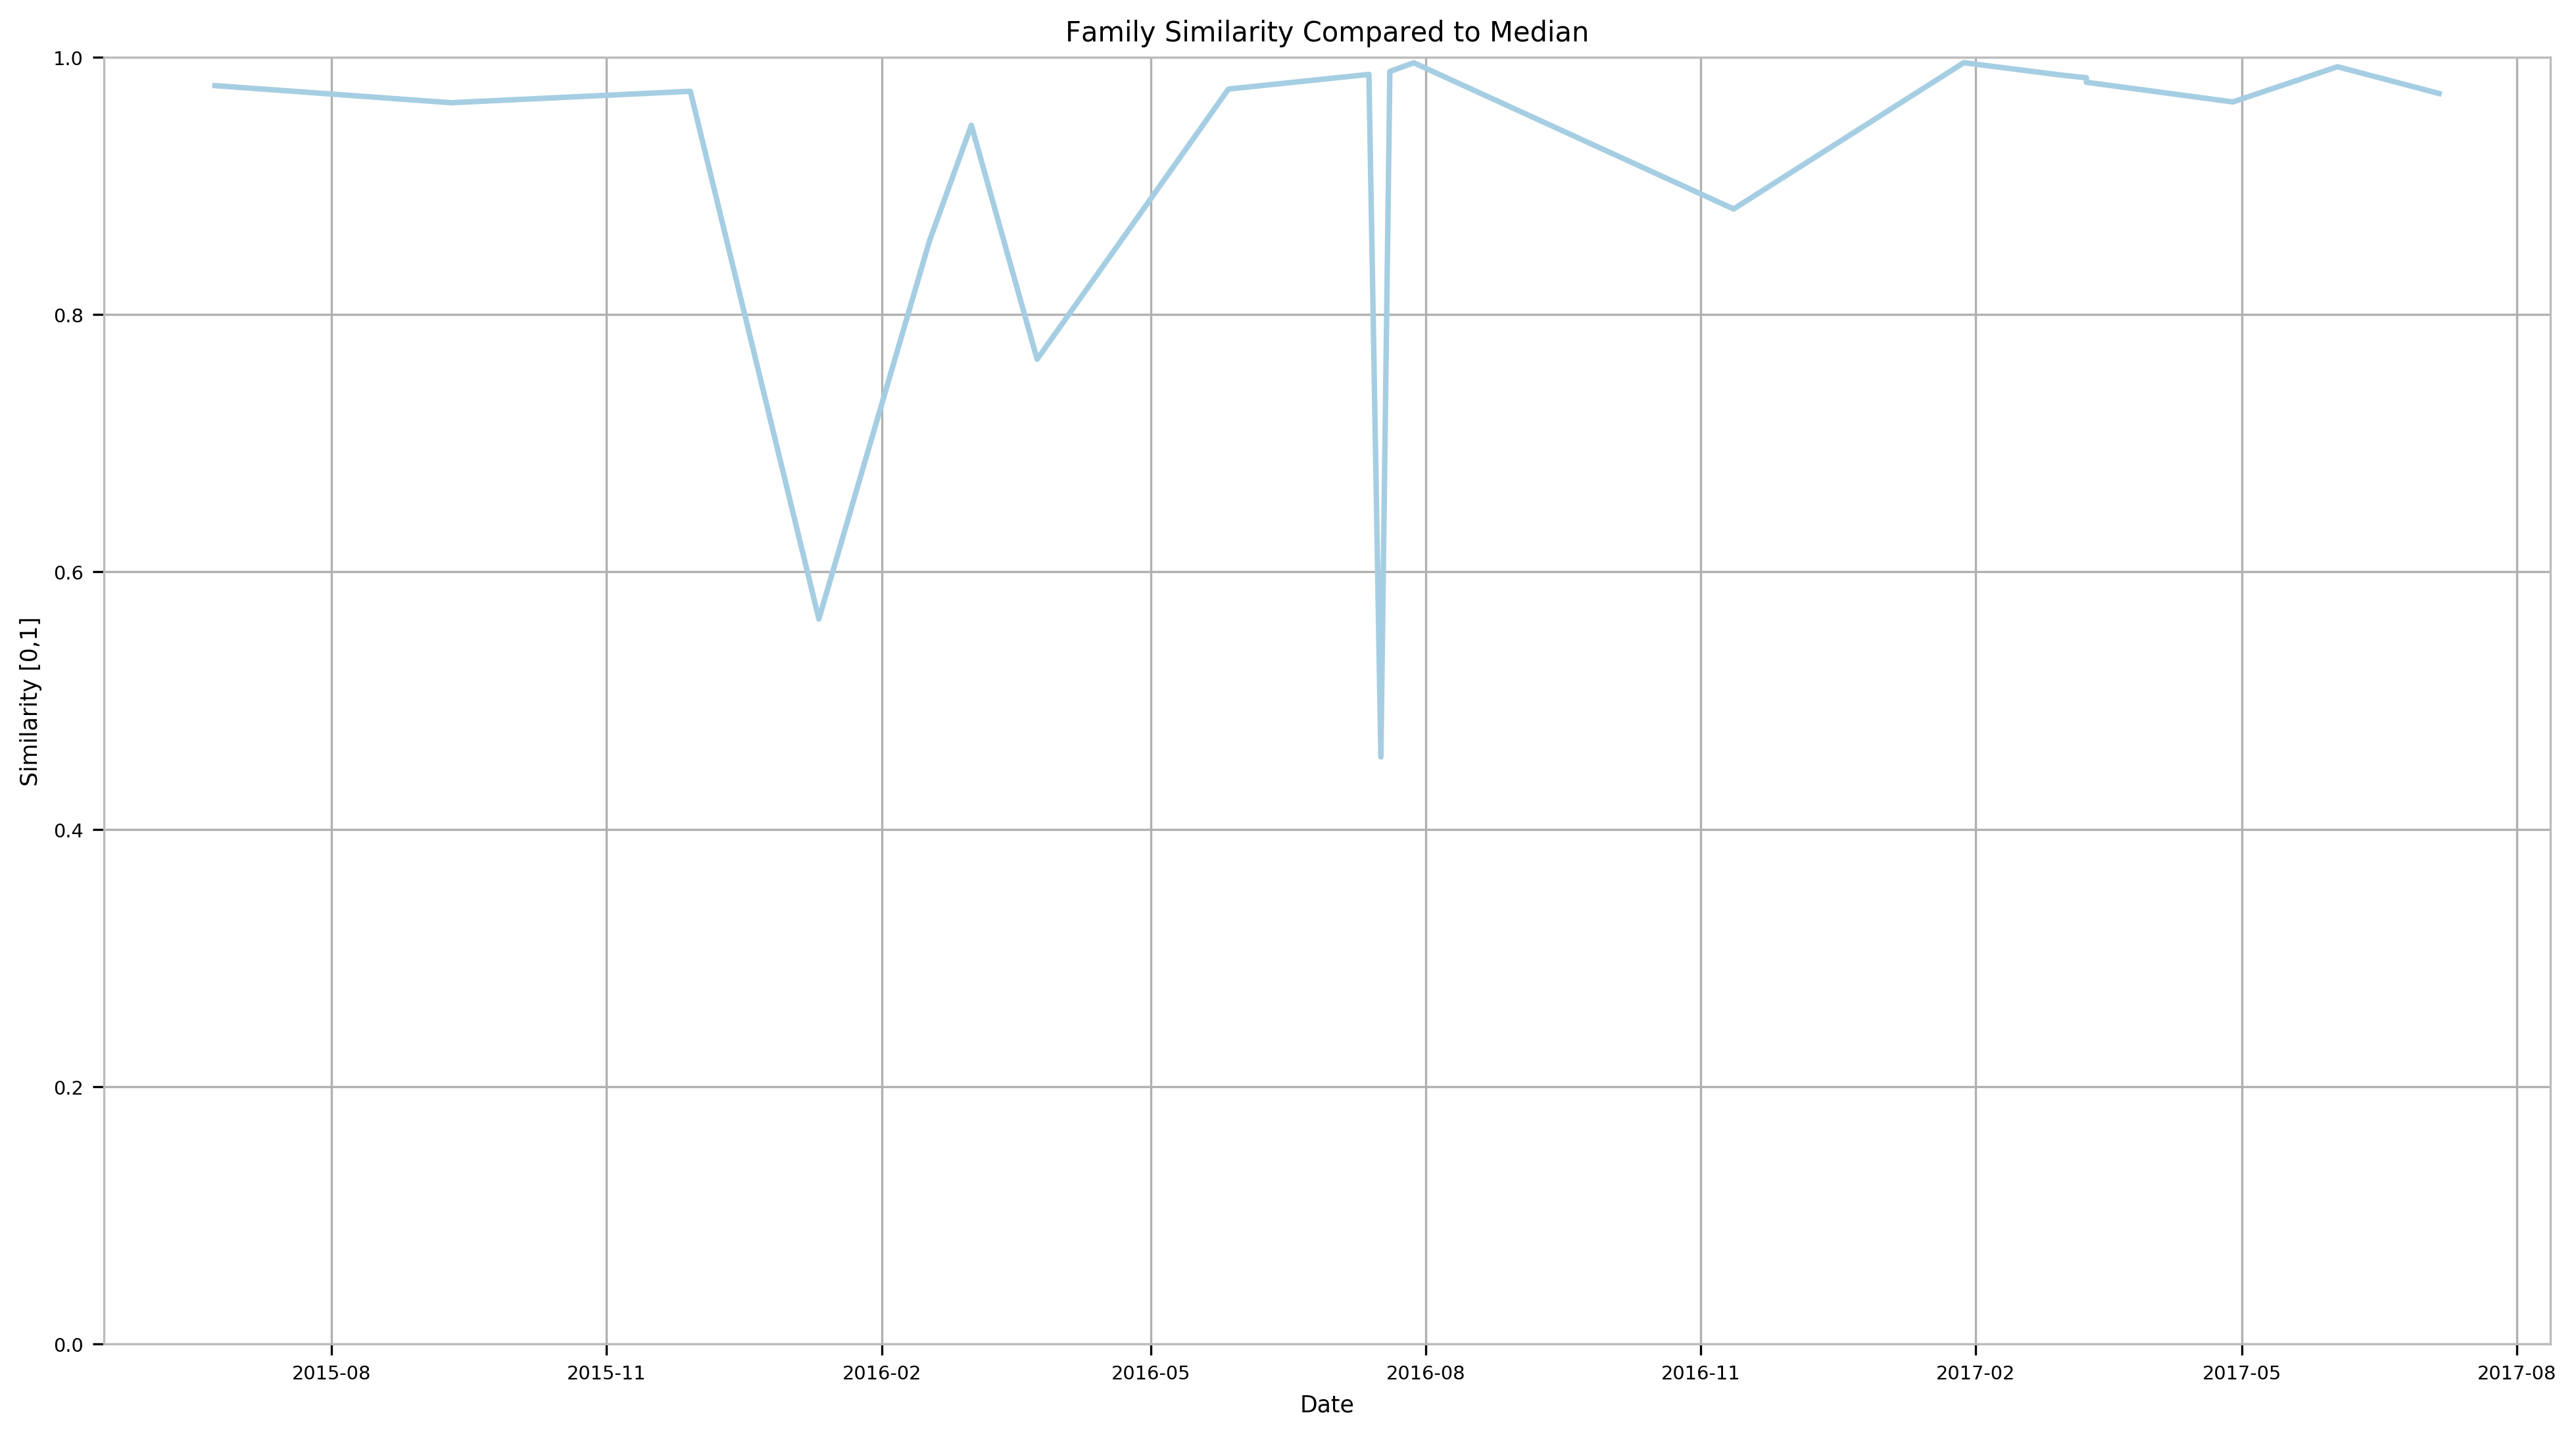