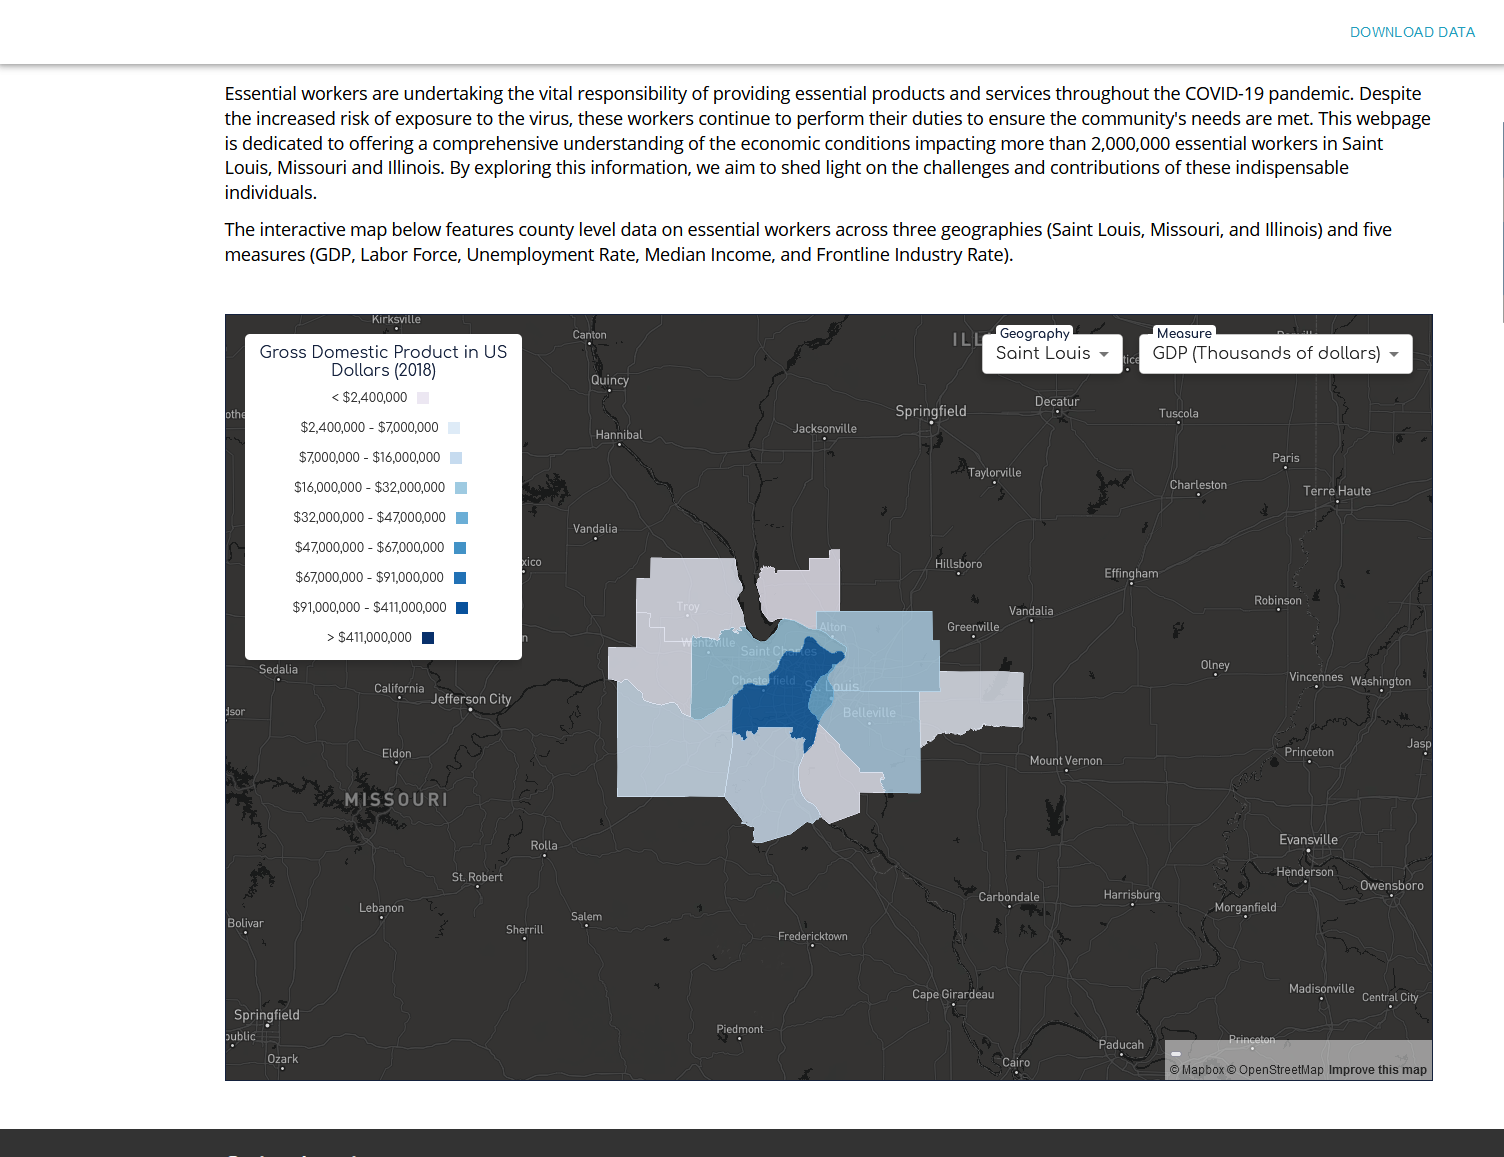
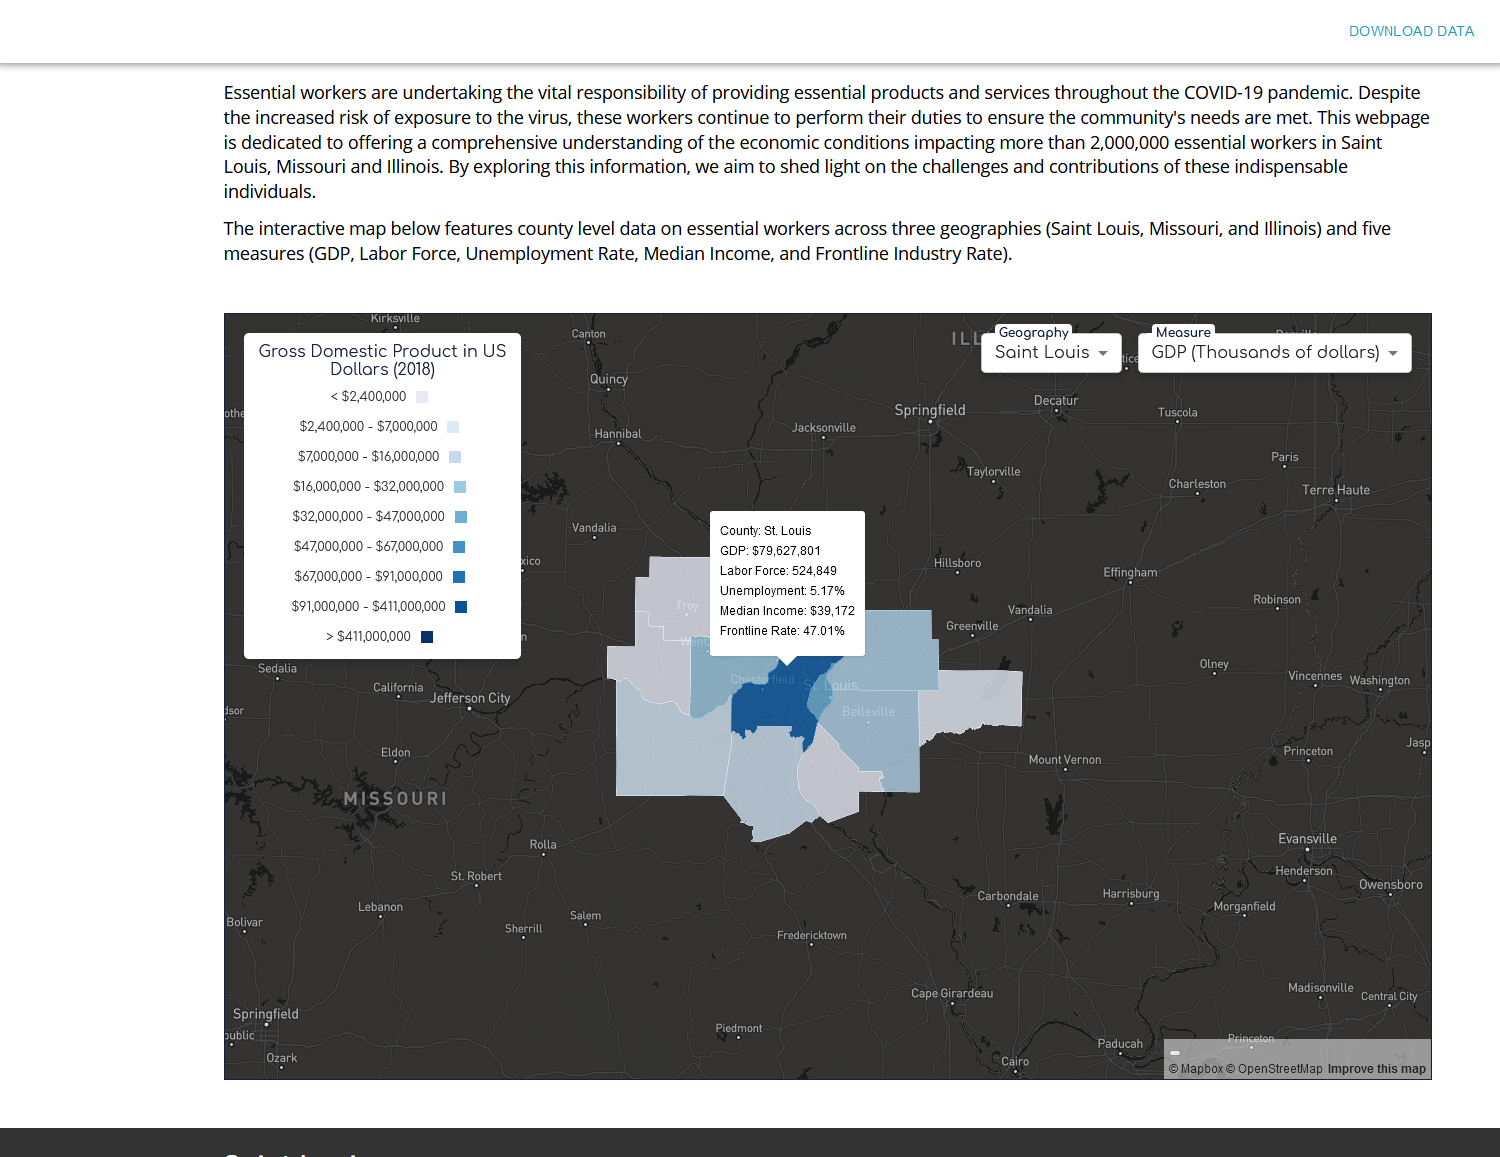
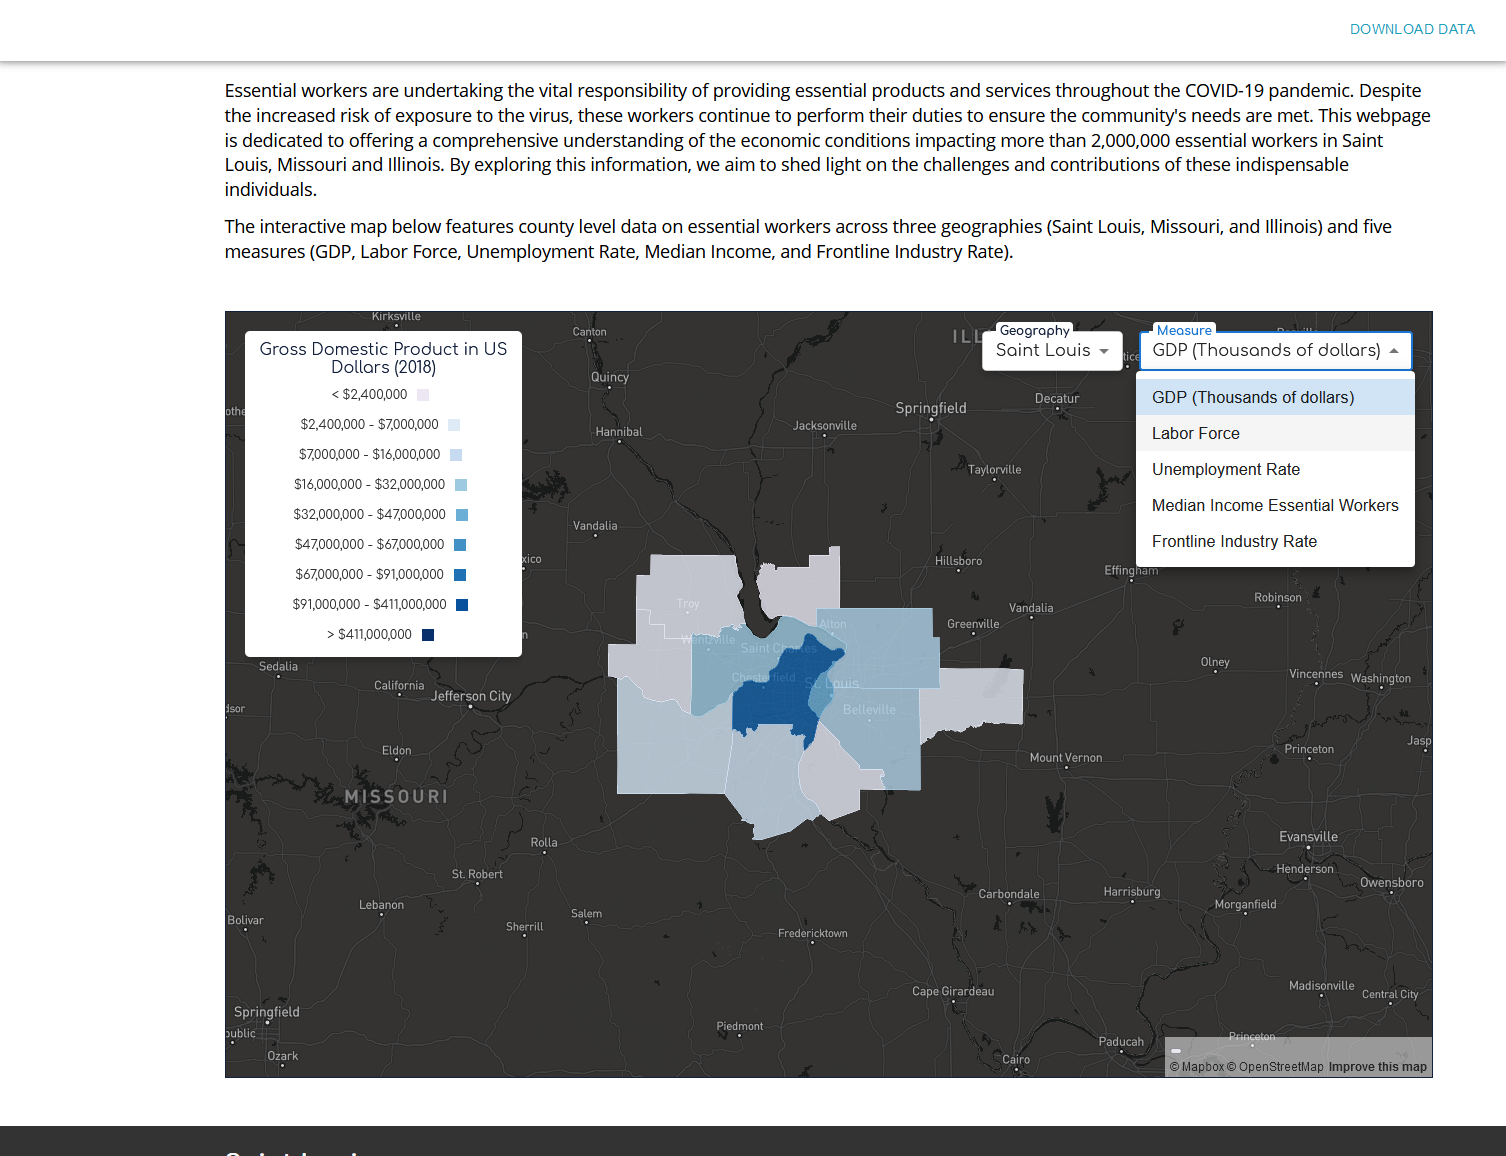
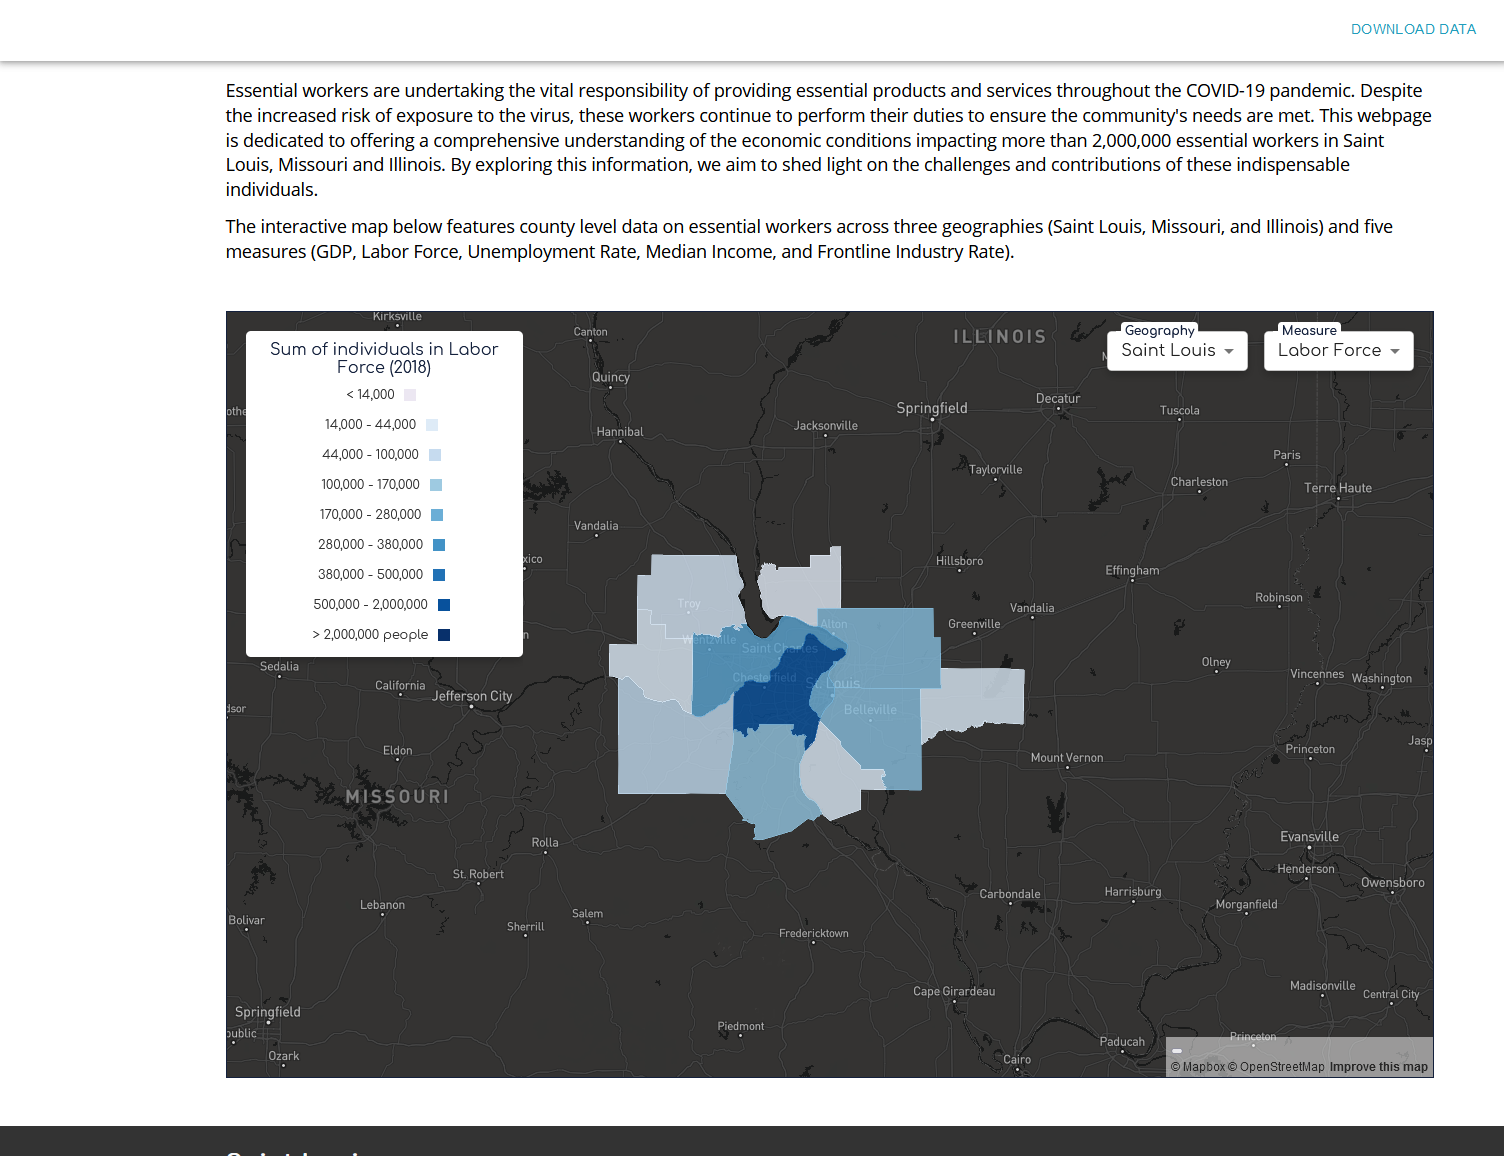
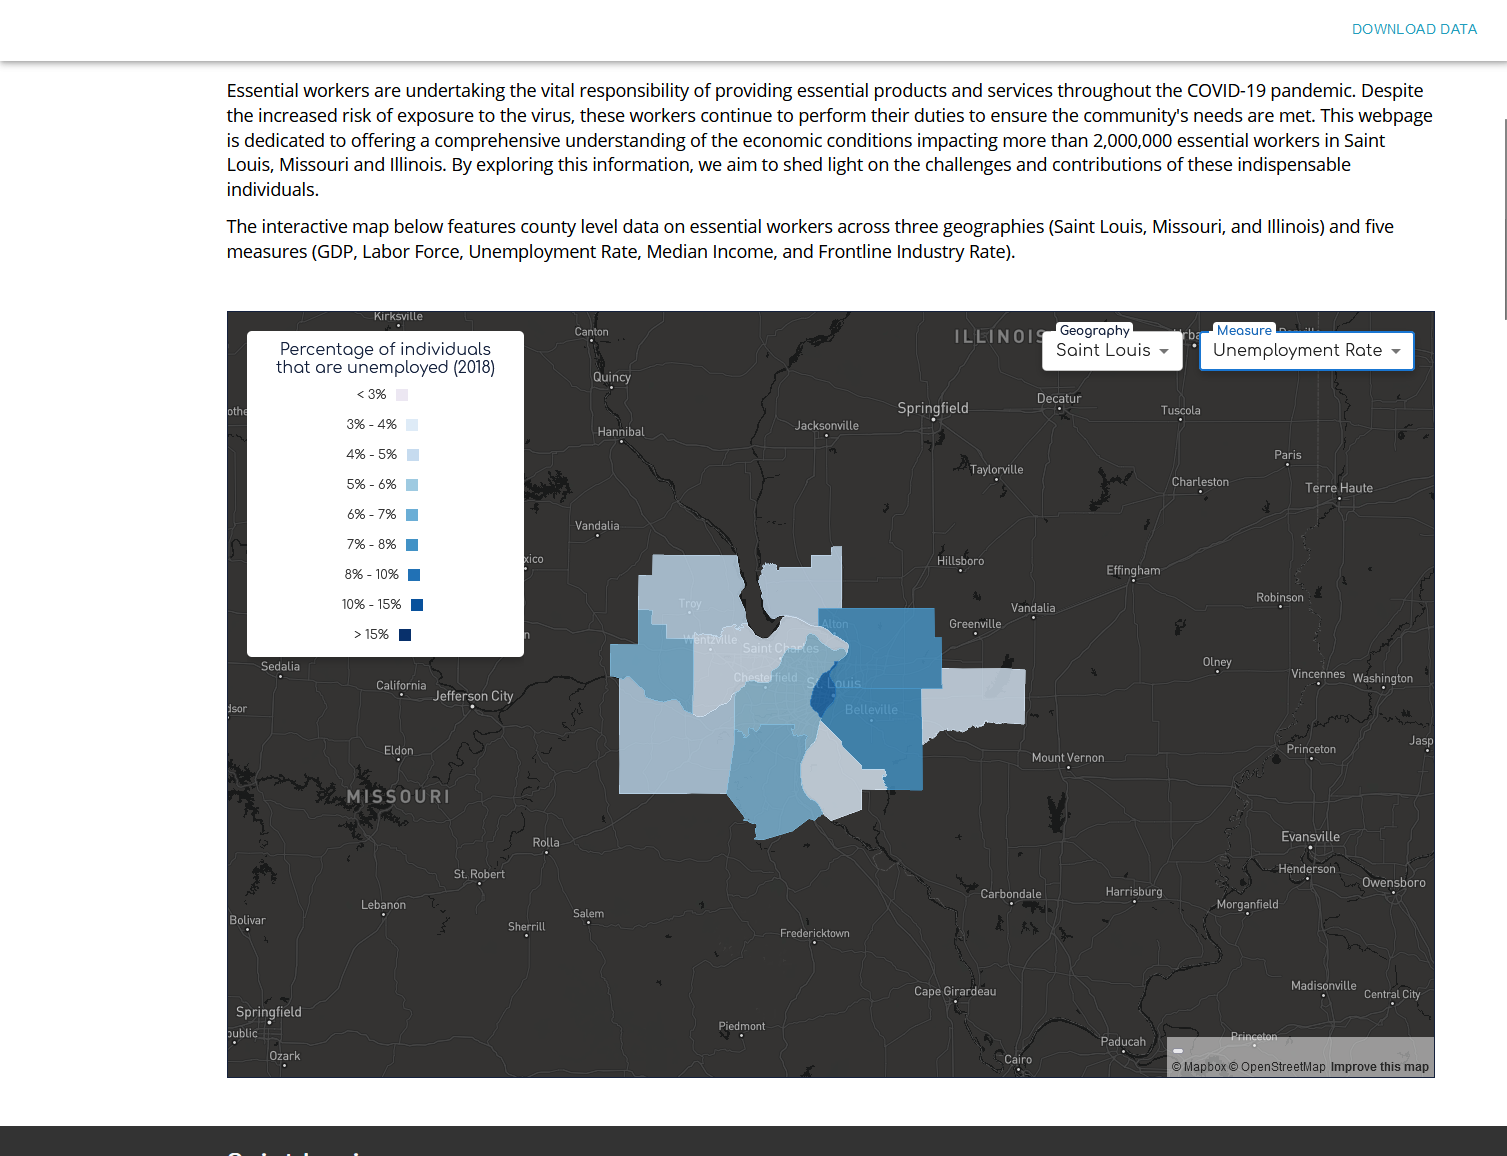
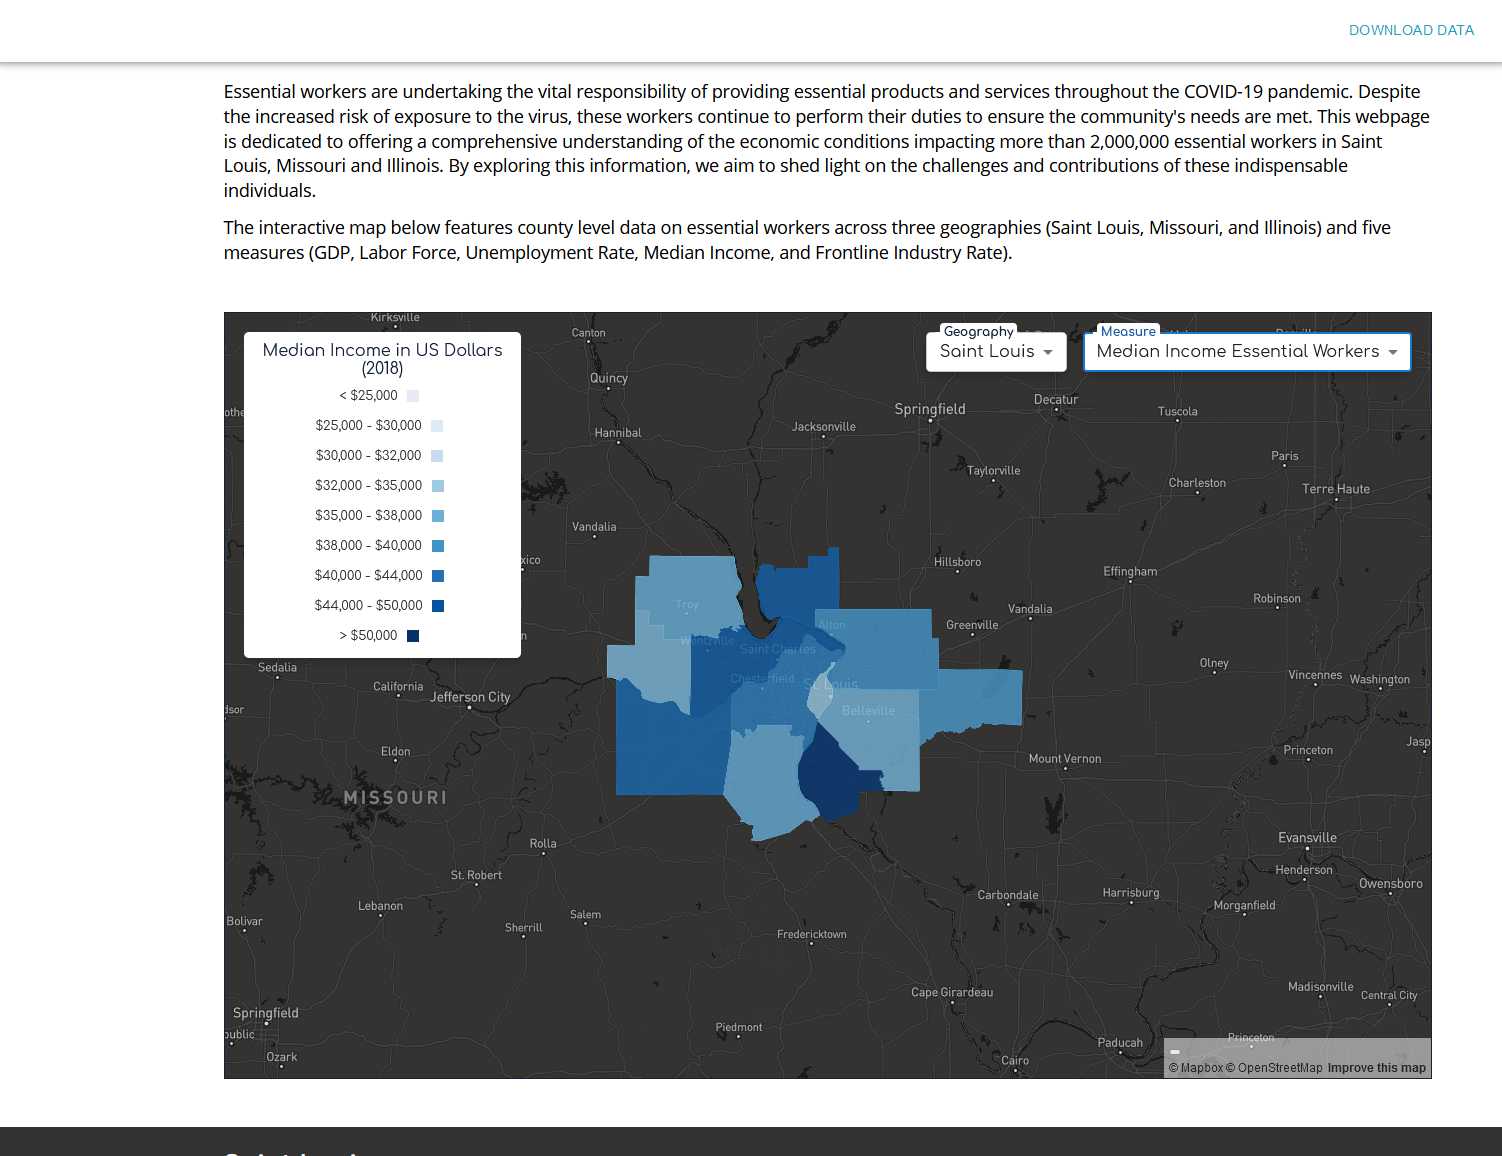
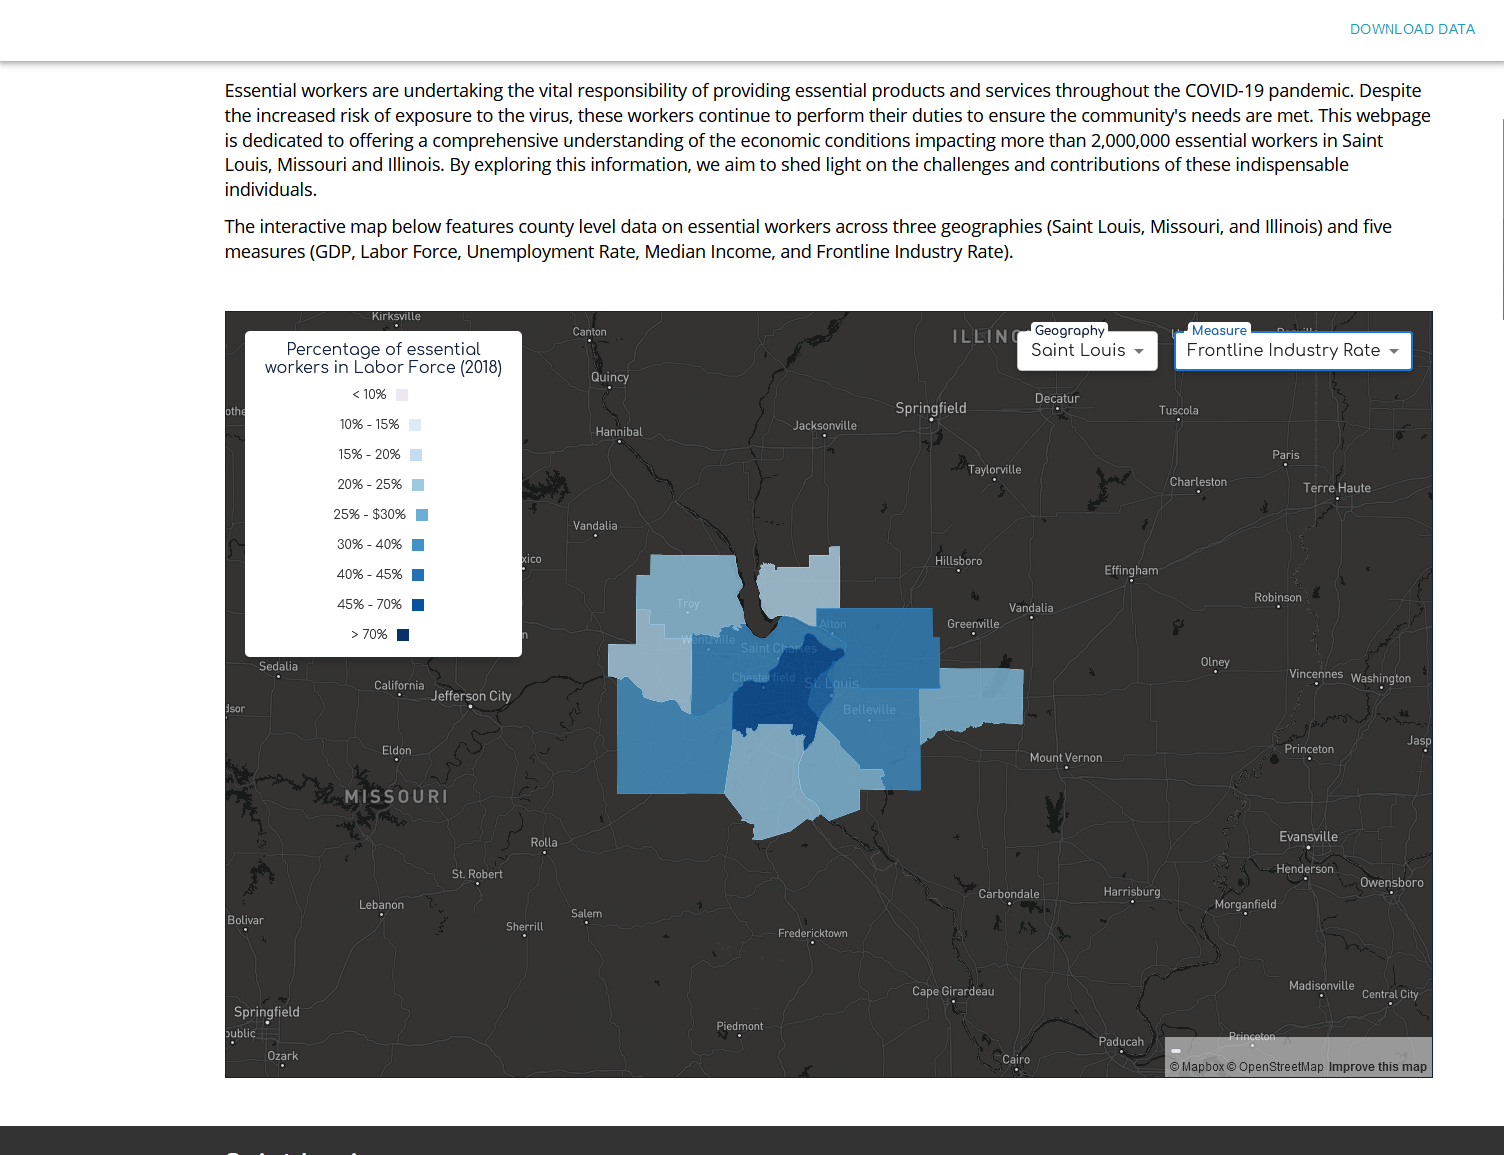
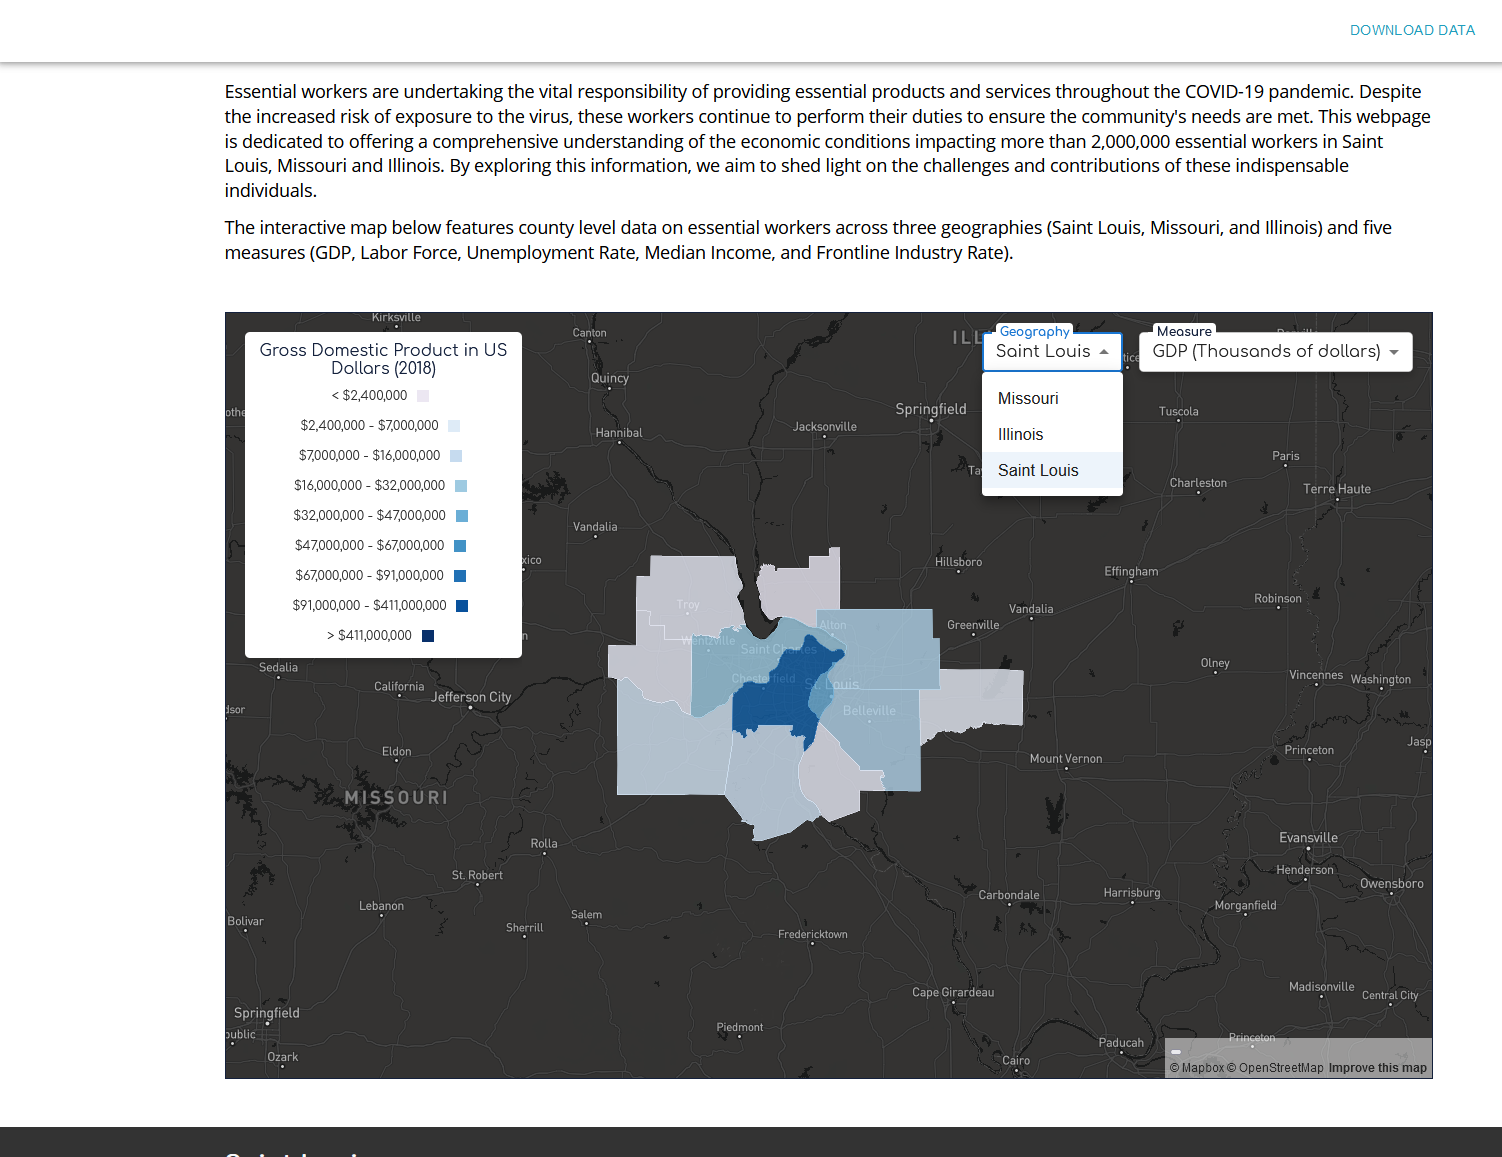
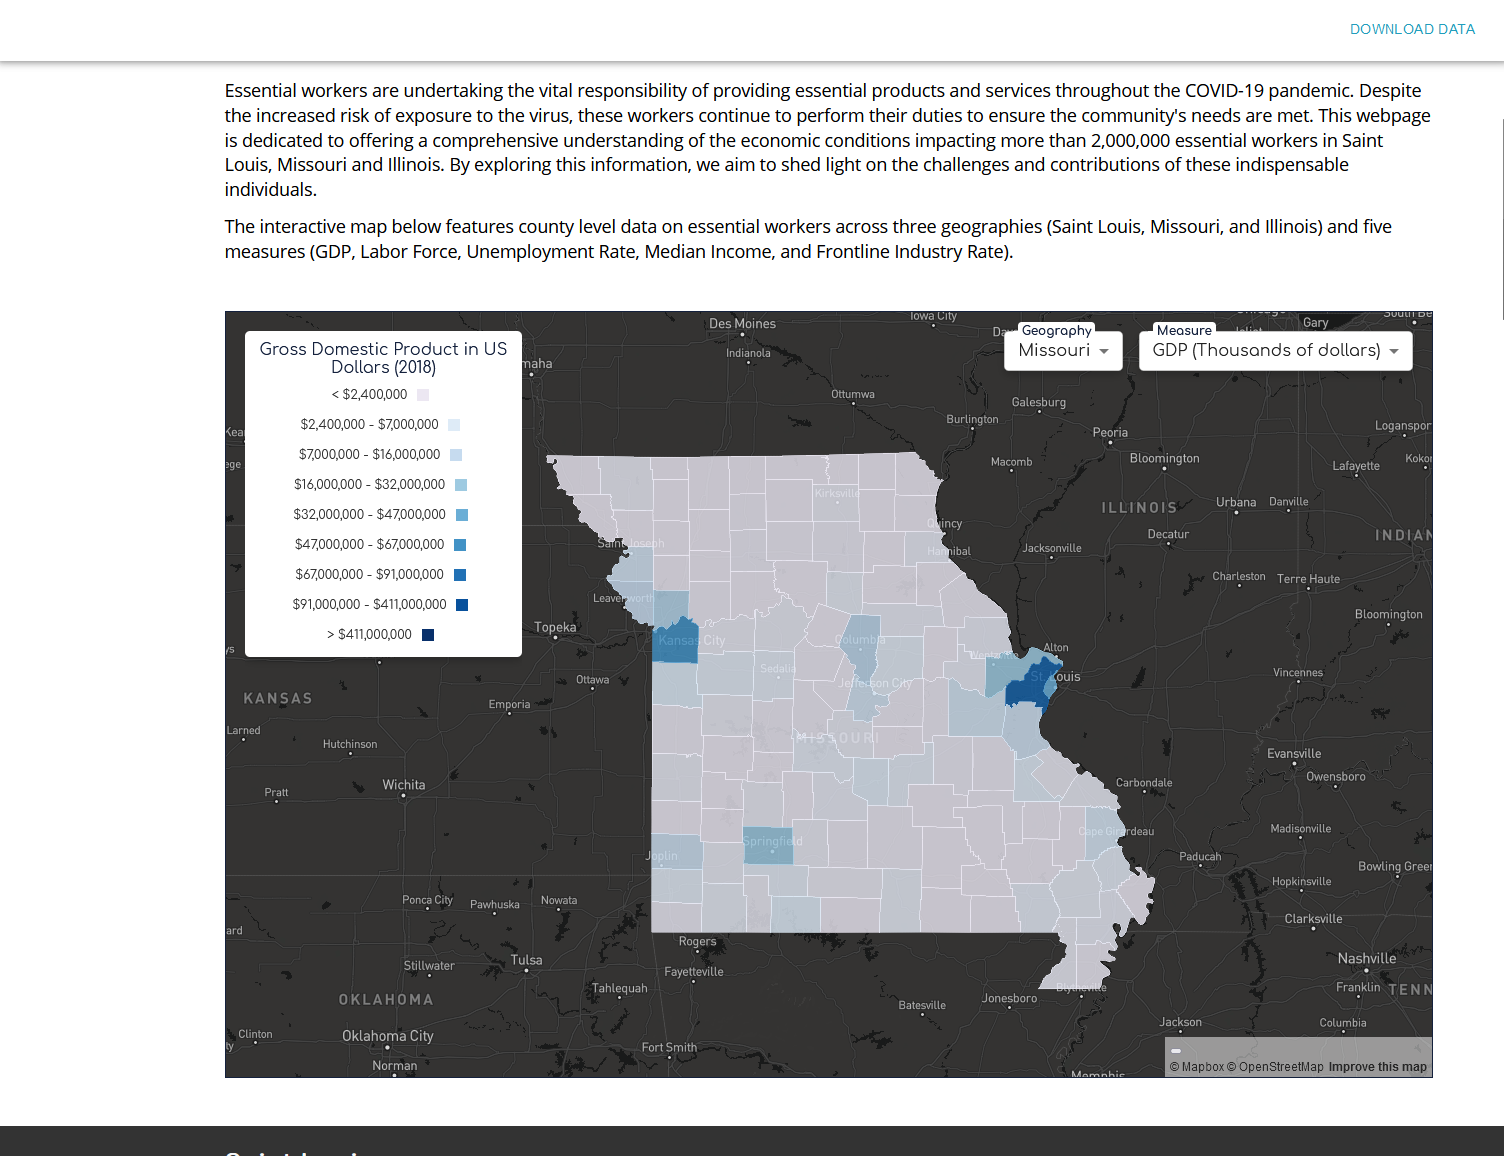
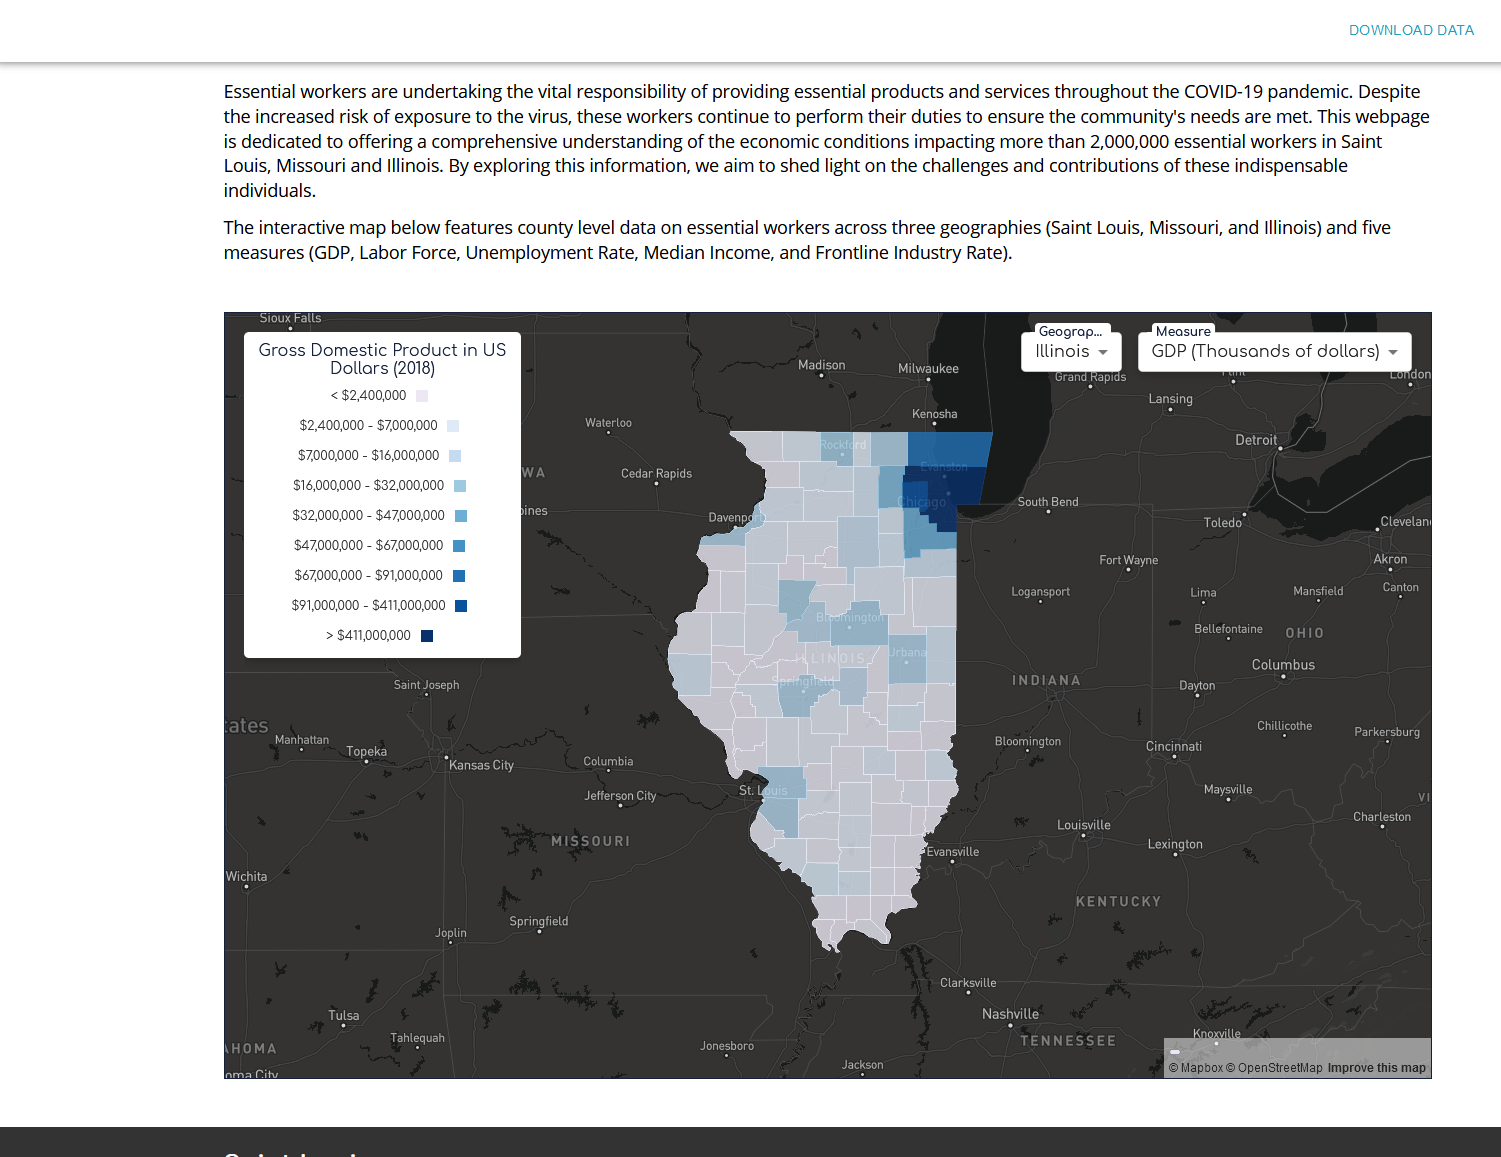
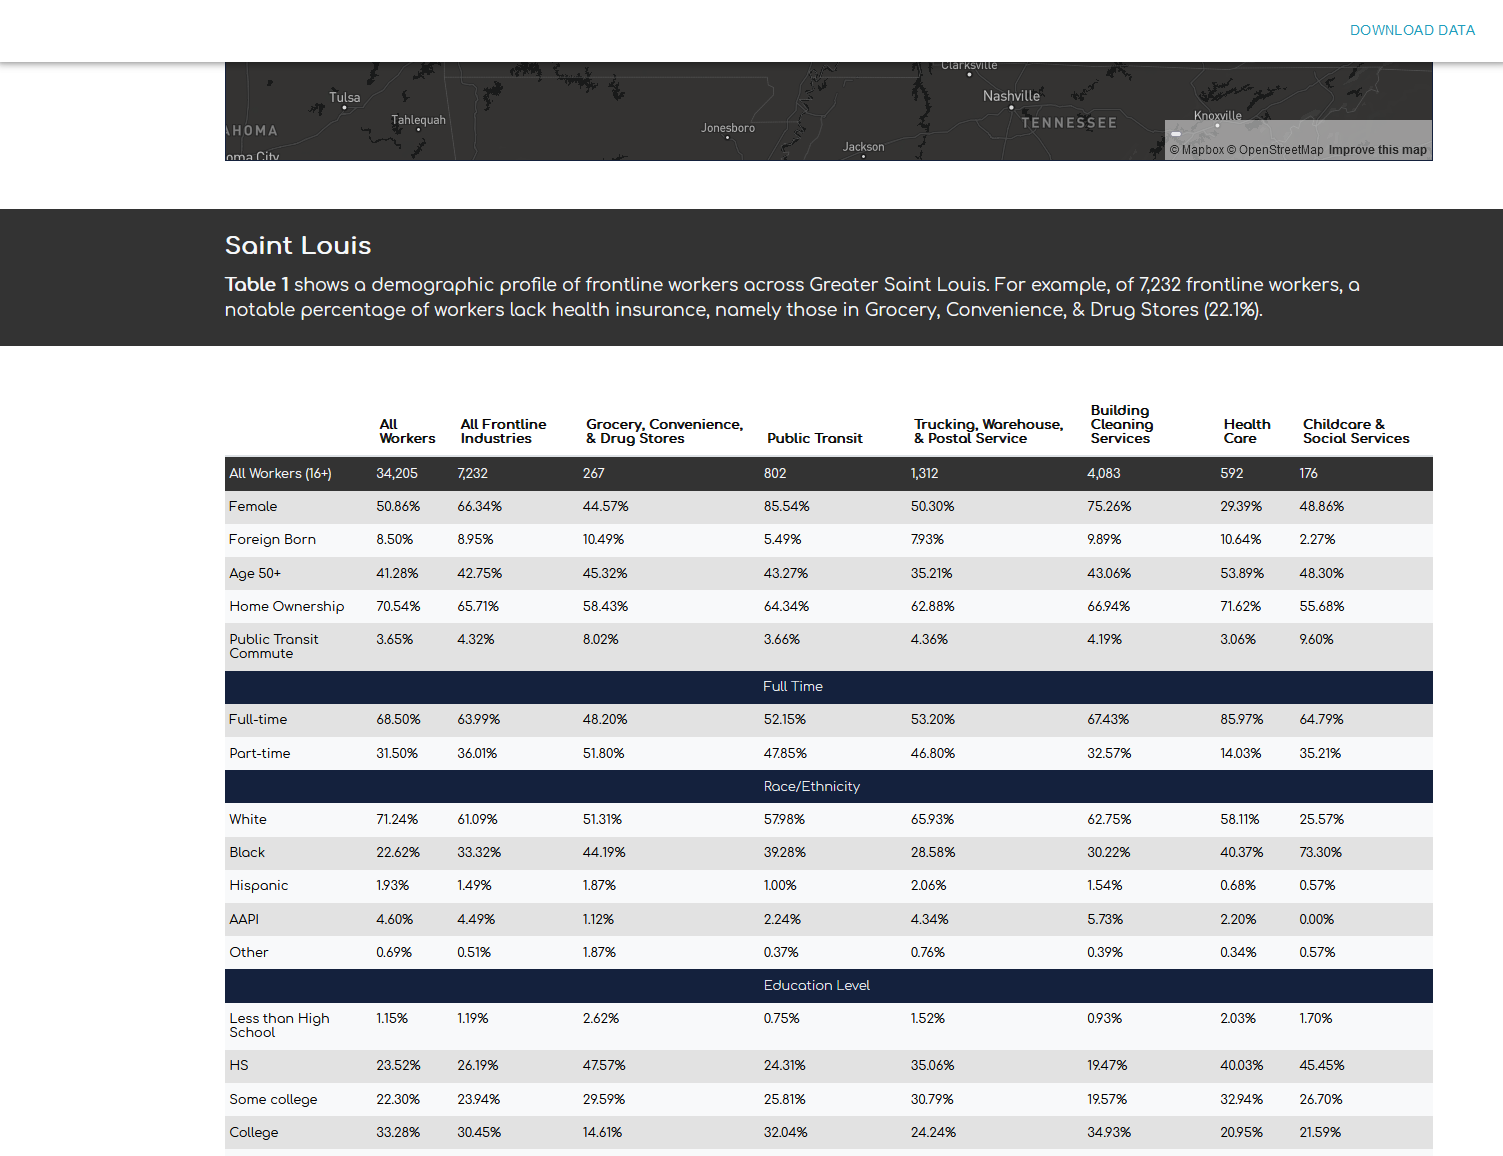
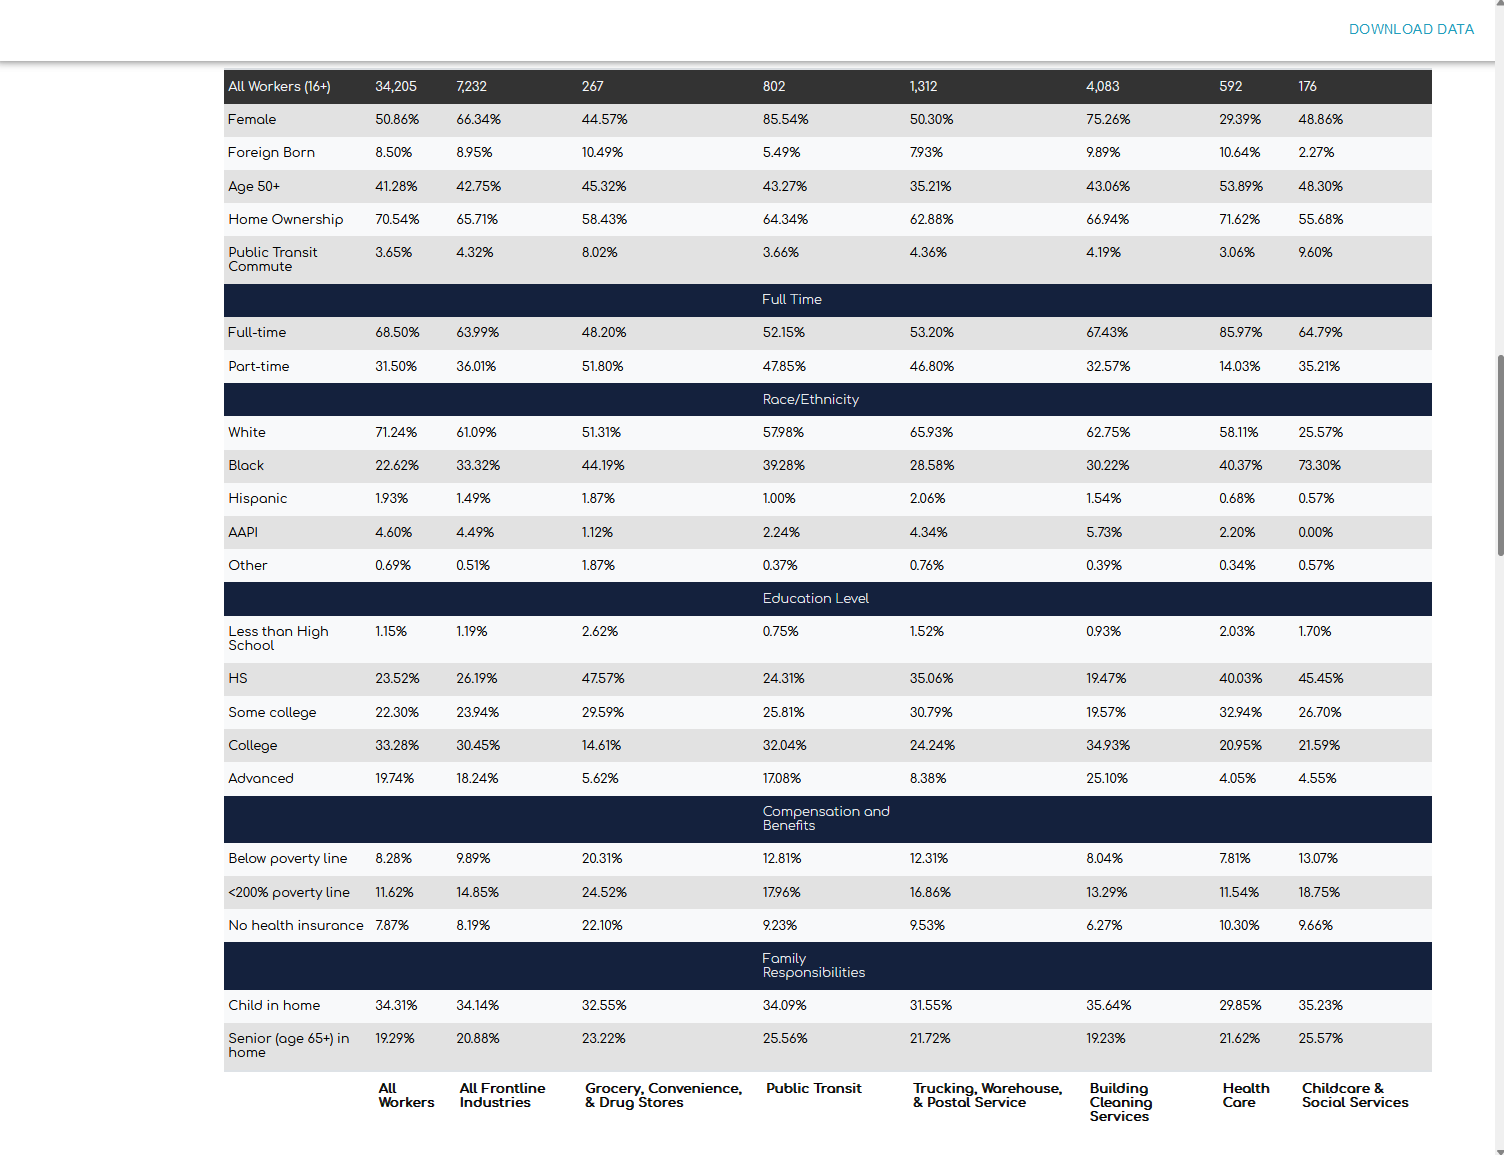
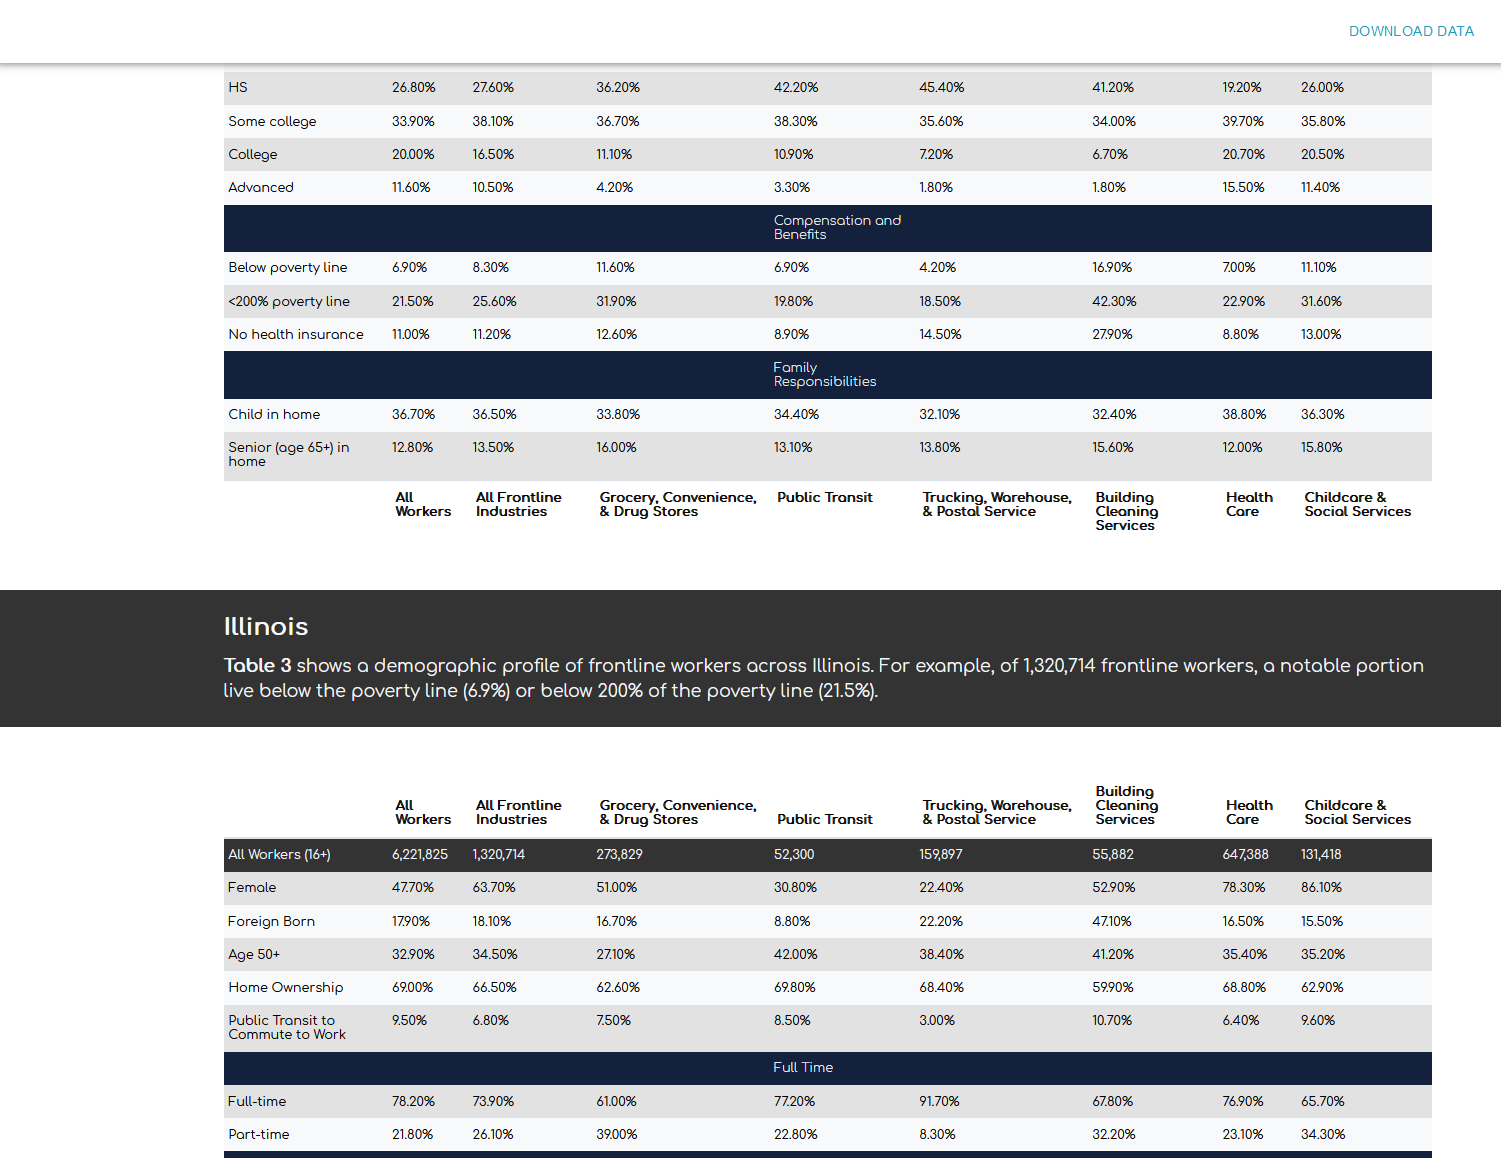
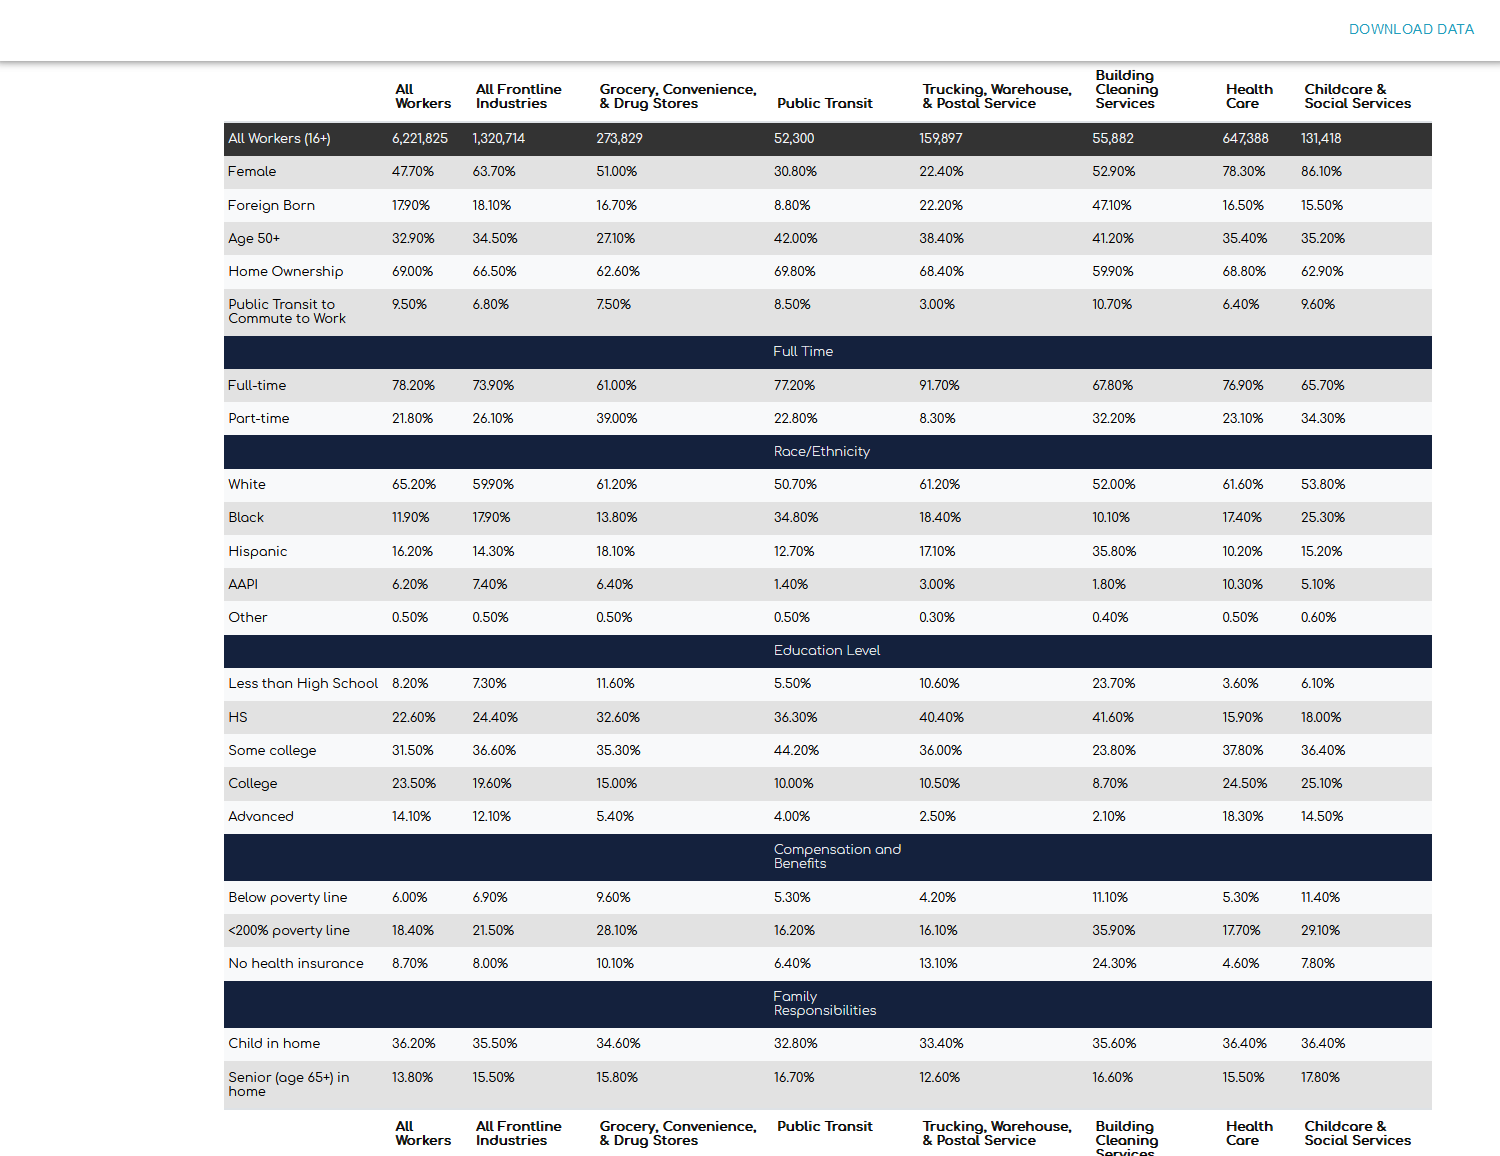
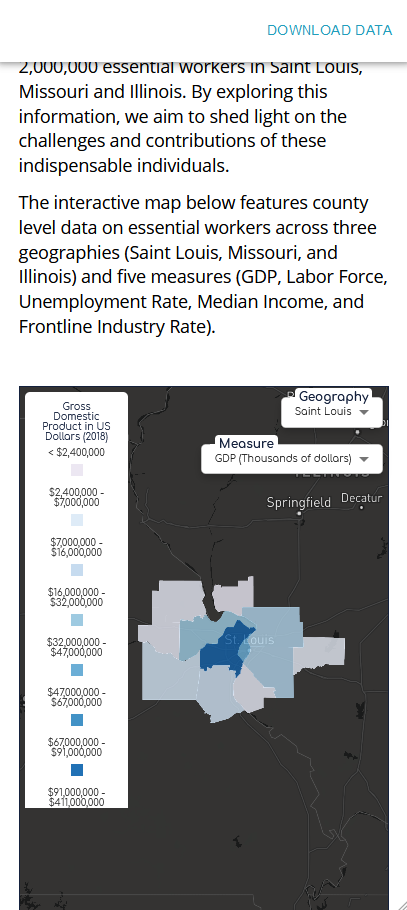
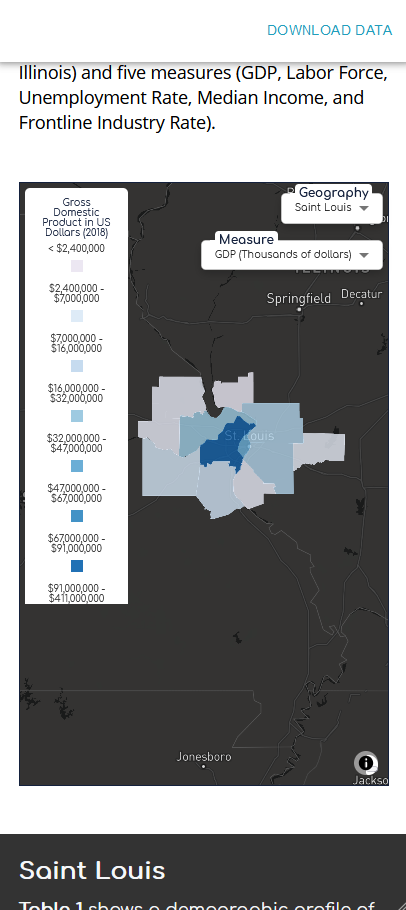
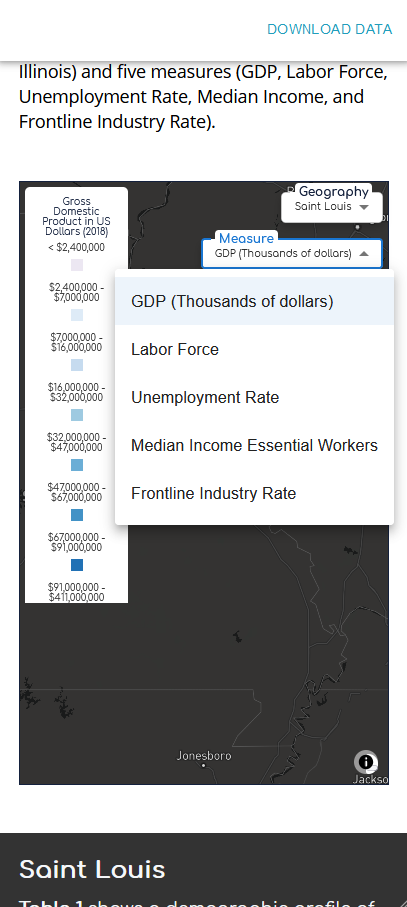
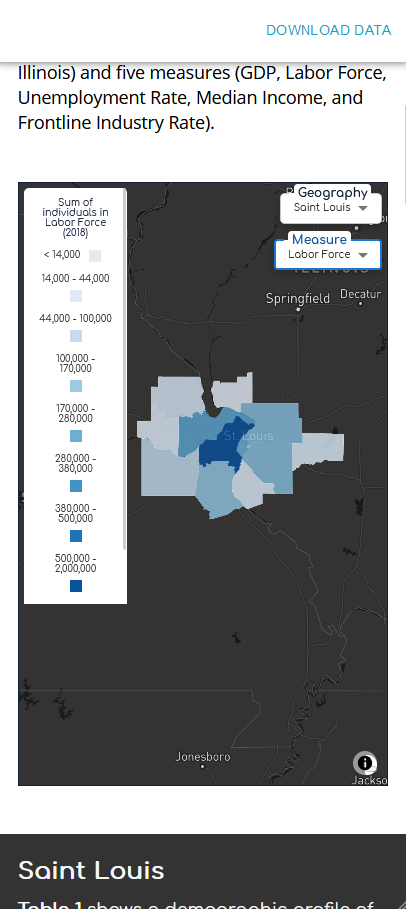
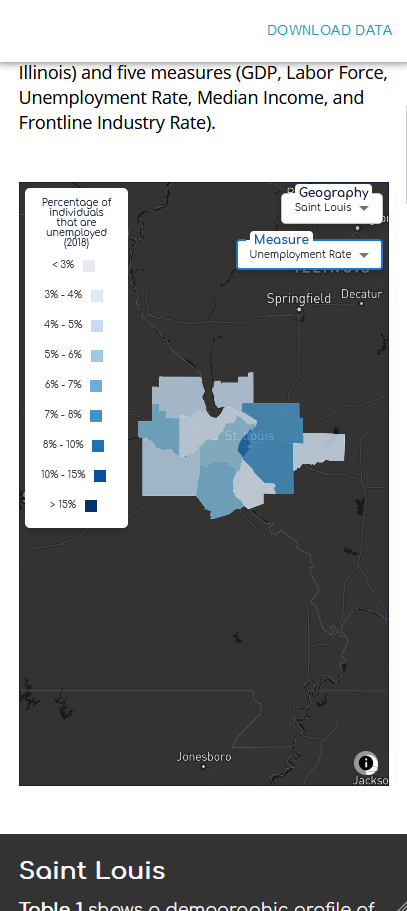
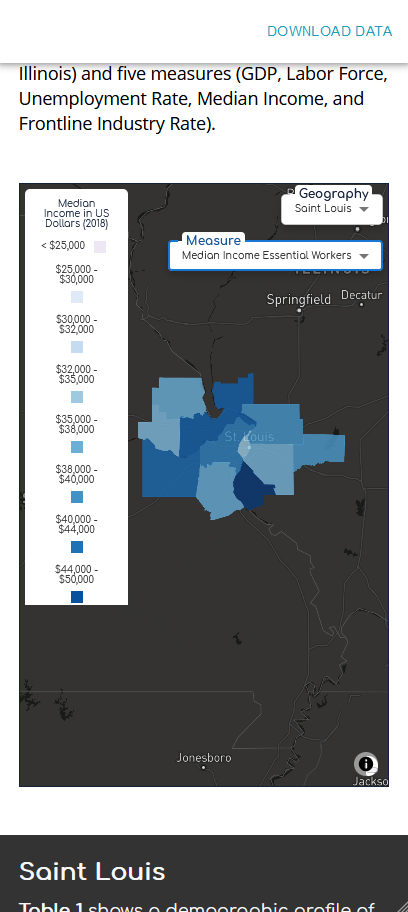
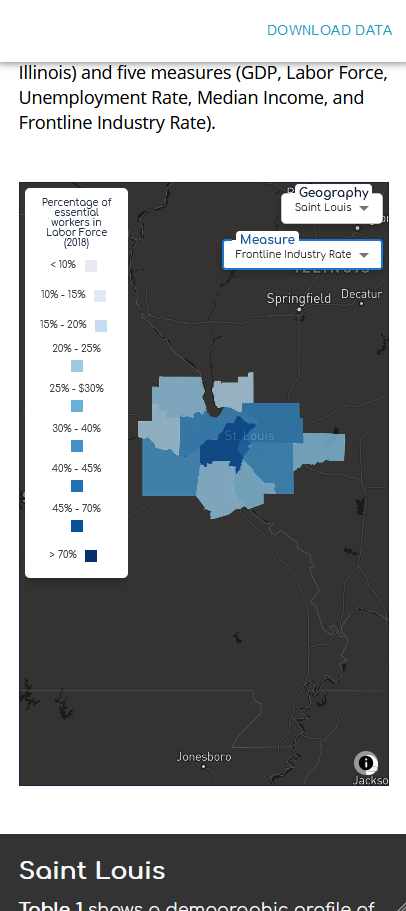
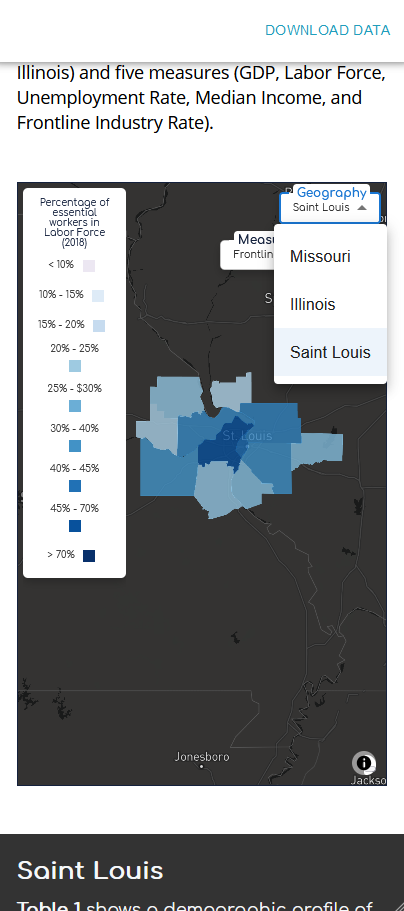
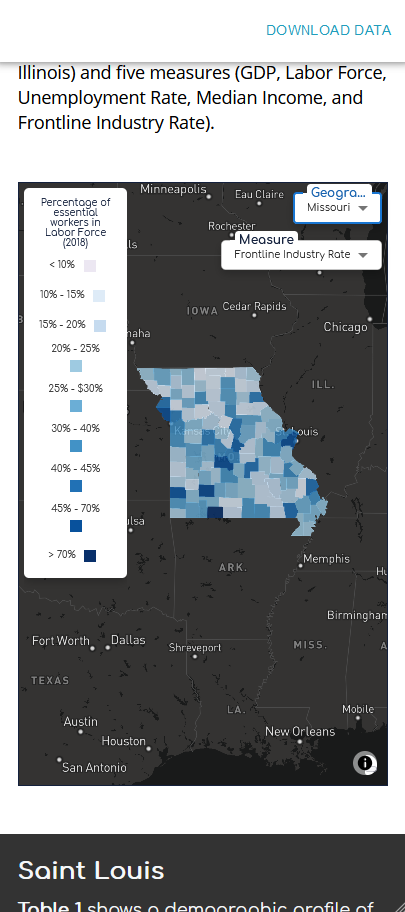
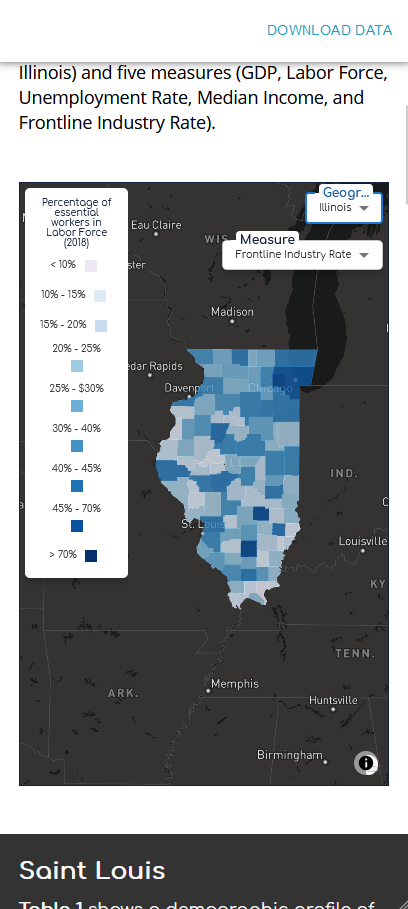
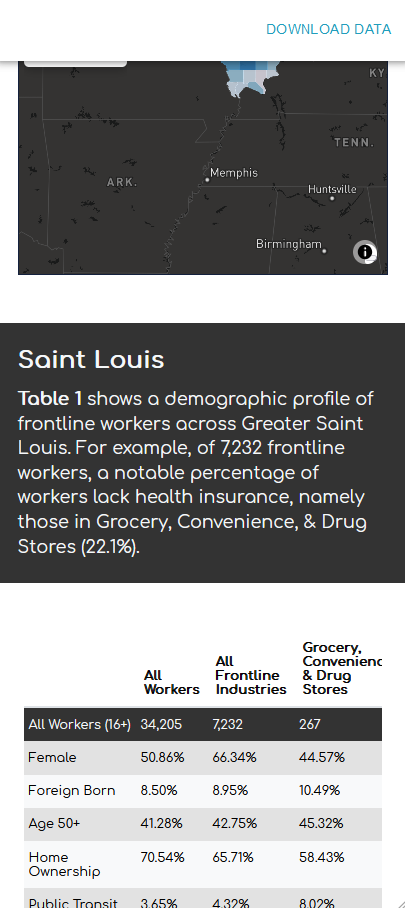
An interactive map and data tables displaying 2018 demographic data including metrics like median income, GDP, and unemployment rates across Saint Louis, Missouri, and Illinois.

An analysis for essential workers in Saint Louis, Missouri, and Illinois. Results are then displayed on an interactive map (via Mapbox) and various data tables.
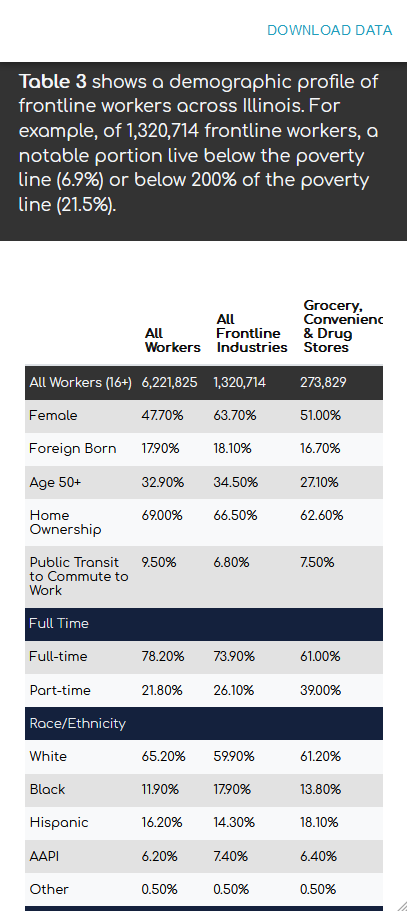
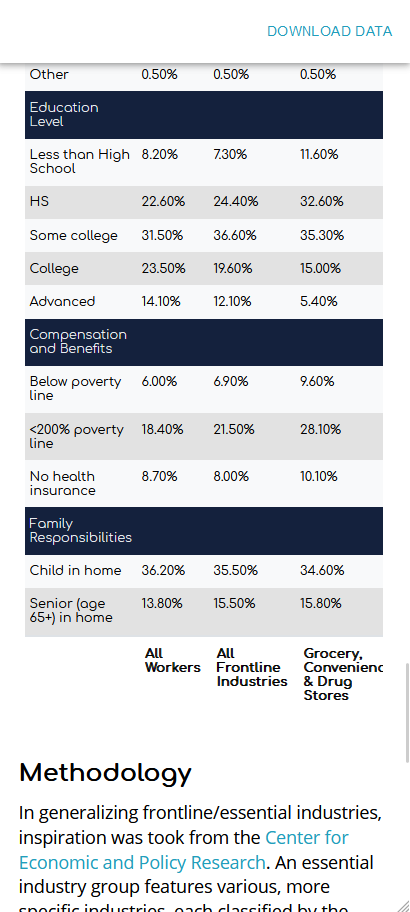
This repository is a detached fork, update, and redesign to Saint Louis Regional Data Alliance's essential-workers, which is a webpage illustrating demographic profiles (2018) of essential workers across Saint Louis, Missouri, and Illinois.
I was one of a few developers on the original project back in 2020. It was my first attempt at a professional webpage (React based or otherwise) and responsive design. The intention of this fork was to update the original in the following ways:
- Updated layout (for simplicity, consistency between mobile and desktop, and overall UX)
- Updated typography (improved consistency, contrast, and overall UX)
- Fixed typos
- Streamlined map controls for changing geography and measure (for improved consistency between mobile and desktop)
- Added toggle button for map legend. It defaults the legend to closed state (improves readability for medium to small screens)
- Formatted display of certain numbers (percentages, currencies, large numbers)
- Corrected bugs with data and data tables that resulted in inaccurate values in columns and rows
- Correct bug with
MapBoximplementation that resulted in needless re-renders - Streamlined styling logic resulting in less code, improved responsiveness, and better performance
- Updated
Reactfrom^16.13.1to^18.3.1 - Updated
mapbox-glfrom^1.12.0to^3.7.0 - Migrated from
CRAtoVitefor faster build times - Removed deprecated
mdbreactandreact-data-table-componentlibraries and replaced with default HTML table elements - Table row headers are now suffixed with geography abbreviation (e.g. STL, IL, MO) to aid in distinguishing tables through scrolling
- Removed
react-map-gldependency - Removed deprecated
Material UIcomponents in favor ofMUIcomponents - Removed any layout based uses of
Material UIin favor of custom CSS - Now uses
TypeScript - Refactors to every file for improved DX
- Replaced hero image
- General redesign relating to colors, wording, and removal of branding
- Added favicon
- Implemented prettier auto formatting
- TypeScript
- JavaScript
- React
- HTML
- CSS
- Material UI (MUI)
- MapBox
- Docker
- Vite