Debugging with PsfMonitor
The PsfMonitor is a GUI application exe that is used to display PSF trace information generated by the PsfTraceFixup, when that fixup has been configured to output to the event log.
PsfMonitor was designed to mimic the interface of the SysInternals tool 'Process Monitor'. While Proccess Monitor is fully compatible with applications running in the MSIX container (even when invoked from outside of the container), there are times that the PsfTraceFixup/PsfMonitor combination may be more useful. To understand this, it may be necessary to understand where PsfTraceFixup and the capture filter driver of Process Monitor are positioned.
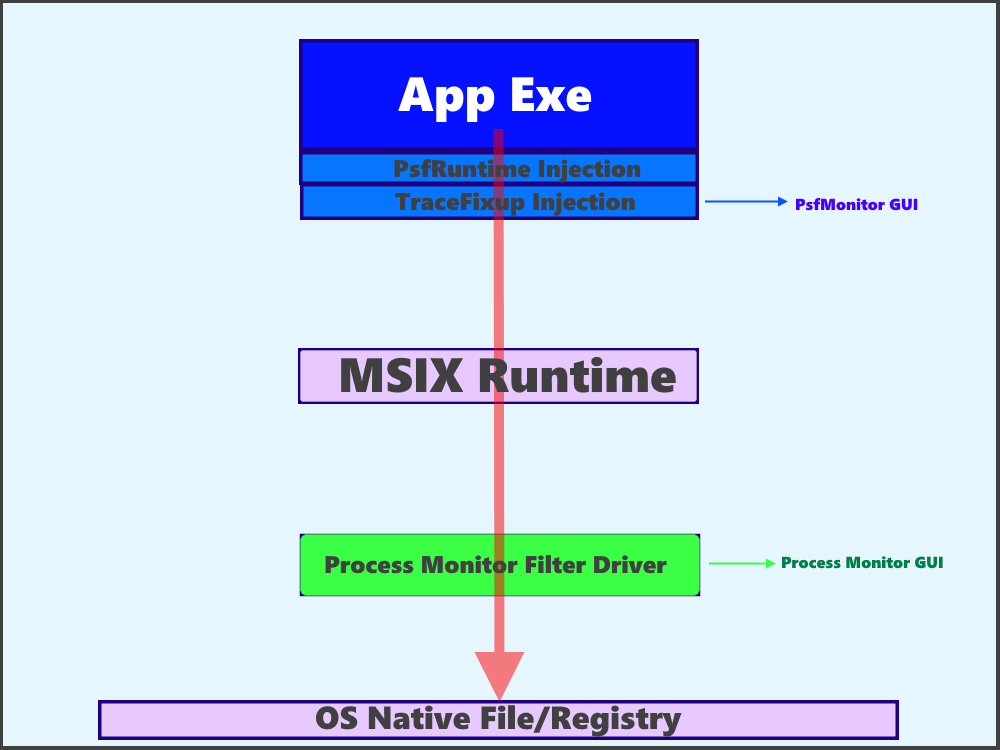
PsfTraceFixup captures the actual call made by the application and the result as returned by the MSIX runtime. The Process Monitor capture happens lower in the OS than the MSIX runtime, which may have altered the call itself. This isn't necessarily a bad thing. The following "rules of thumb" apply when deciding which approach to use:
- Use 'Process Monitor' when 'PsfTraceFixup' is not already part of the package and you don't want to repackage.
- Use 'PsfTraceFixup' when you want to monitor the actual call/response as seen by the application. The trace fixup logs activities at the same points that the other PSF fixups target. You may also want to use 'PsfTraceFixup' precisely because it does not log a lot of Windows API activities, so there are fewer events to look through in the trace. For example, calls to actually read and write to files and registry values are not traced which dramatically reduces the number of captured events.
Although PsfMonitor may be run externally, it normally is included in the package since you are already adding in the PsfTraceFixup. PsfMonitor is traditionally configured from within PsfLauncher as the 'monitor' in the PsfLauncher configuration. This means that PsfLauncher will first startup PsfMonitor, and then start the target application after injecting the PsfTraceFixup.
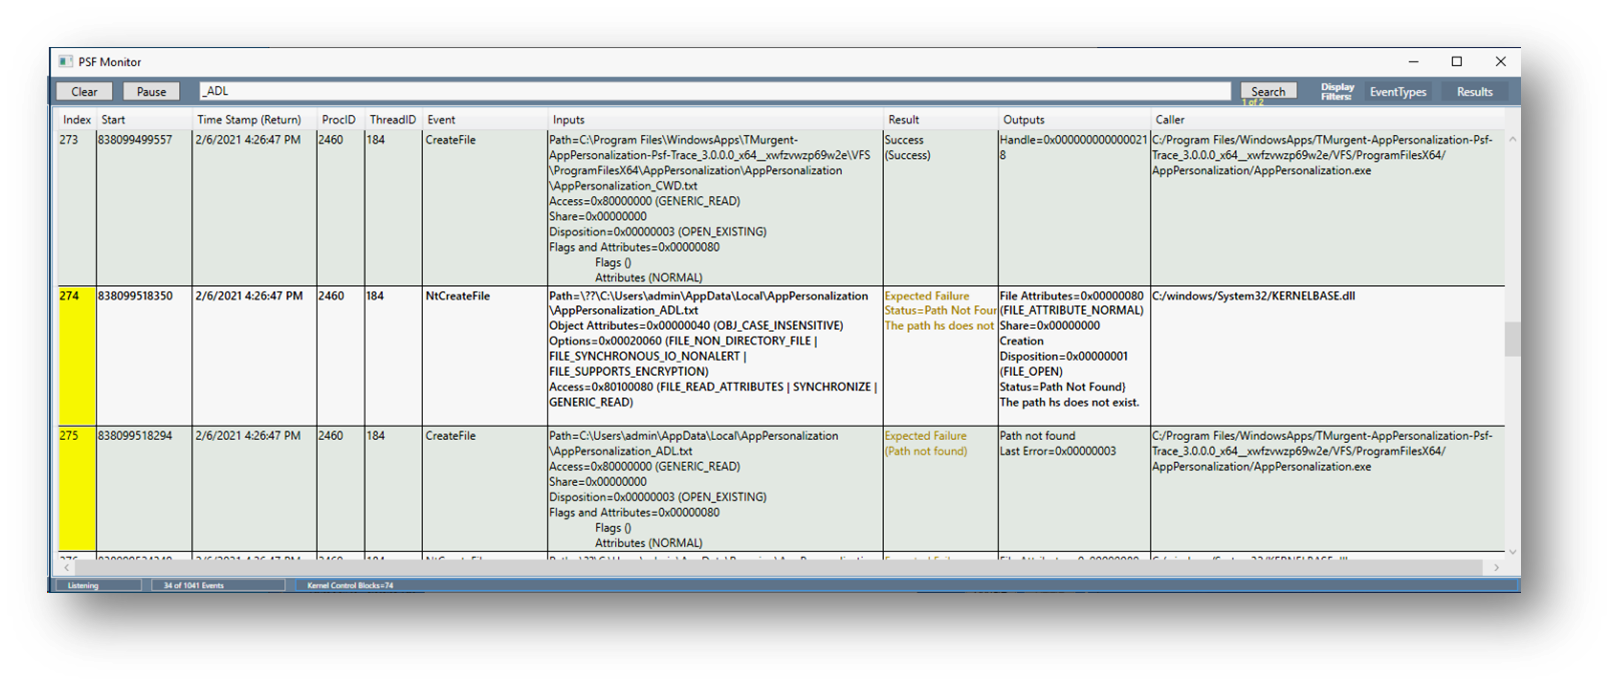
PsfMonitor automatically captures the information produced by PsfTraceFixup when that fixup is configured to output to the Event log. It also can pick up some additional trace information available to it (which is controlled in-app using the 'EventsTypes' button. Here is an example of the PsfMonitor when tracing an application that is having trouble locating a file that is part of the package VFS\LocalAppData folder:
The primary features of the PsfMonitor Gui include:
The controls at the top include the following items:
- 'Clear' button. This button is used to clear out all entries from the display area.
- 'Pause' button. This button is used to pause or resume the capture of additional events.
- 'Search' textbox and button. You may enter a partial string and click on the search button to search for entries that contain a case sensitive match in any field. Events that have a match are highlighted in yellow and the display will scroll to the first item found. Clicking the search button again will jump to the next found item. A count is display just below the search button.
- 'EventTypes' button. This will display a list of event types that you can choose to capture. If already captured, unchecking the item will temporarily hide the items from the display.
- 'Results' button. This will display a list of result codes in checkbox form. It will hide results with the types of items in this form that have unchecked result types.
Unlike Process monitor, that only captures a timestamp for the return result, PsfTraceFixup captures a timestamp for the start of request and the return. By default it sorts by this start time since we typically want to see the order from the apps viewpoint, but you may click on any column header to sort by that column.
The tool separates event parameters into Inputs (things requested by the app) and Outputs (things returned by the call). These fields are typically intermingled in the Process Monitor "Details" column.
The tool attempts to help you understand file and registry calls that failed in ways that may be expected by the app. Quite often apps (or other Windows APIs called by the app) will make these calls to see if such a thing is present. These appear in the Result column as 'Expected Failure', along with the actual return code. These items may still be failures, as it was in the example above, so you have to consider such entries individually. It's better than just calling it a failure outright, but discretion in interpretation is advised.
Below is a sample config.json file that contains the typical configuration for PsfTraceFixup and PsfMonitor:
{
        "applications": [
        {
            "id": "PSFLAUNCHERSixFour",
            "executable": "PrimaryApp.exe",
            "arguments": "/AddedArg"
            "workingDirectory": "",
            "monitor": {
                "executable": "PsfMonitor.exe",
                "arguments": "",
                "asadmin": true,
   	    }
	}
  	],
        "processes": [
        {
            "executable": "PsfLauncher.*",
            "fixups": [
            ]
        },
        {
            "executable": "PrimaryApp$",
            "fixups": [
            {
                "dll": "TraceFixup64.dll",
                "config": {
                    "traceMethod": "eventlog",
                    "traceLevels": {
                        "default": "always"
                    }
                }
            }
            ]
        }
}PsfTraceFixup and PsfMonitor have several dependent dlls that are required to also be part of the package.
More information on PsfMonitor is available from the PsfMonitor Developer Documentation page.
Information on PsfTraceFixup may be found from the wiki PsfLauncher page.
Information on an alternative form of debugging is also found on the wiki Debugging with DebugView Documentation page.